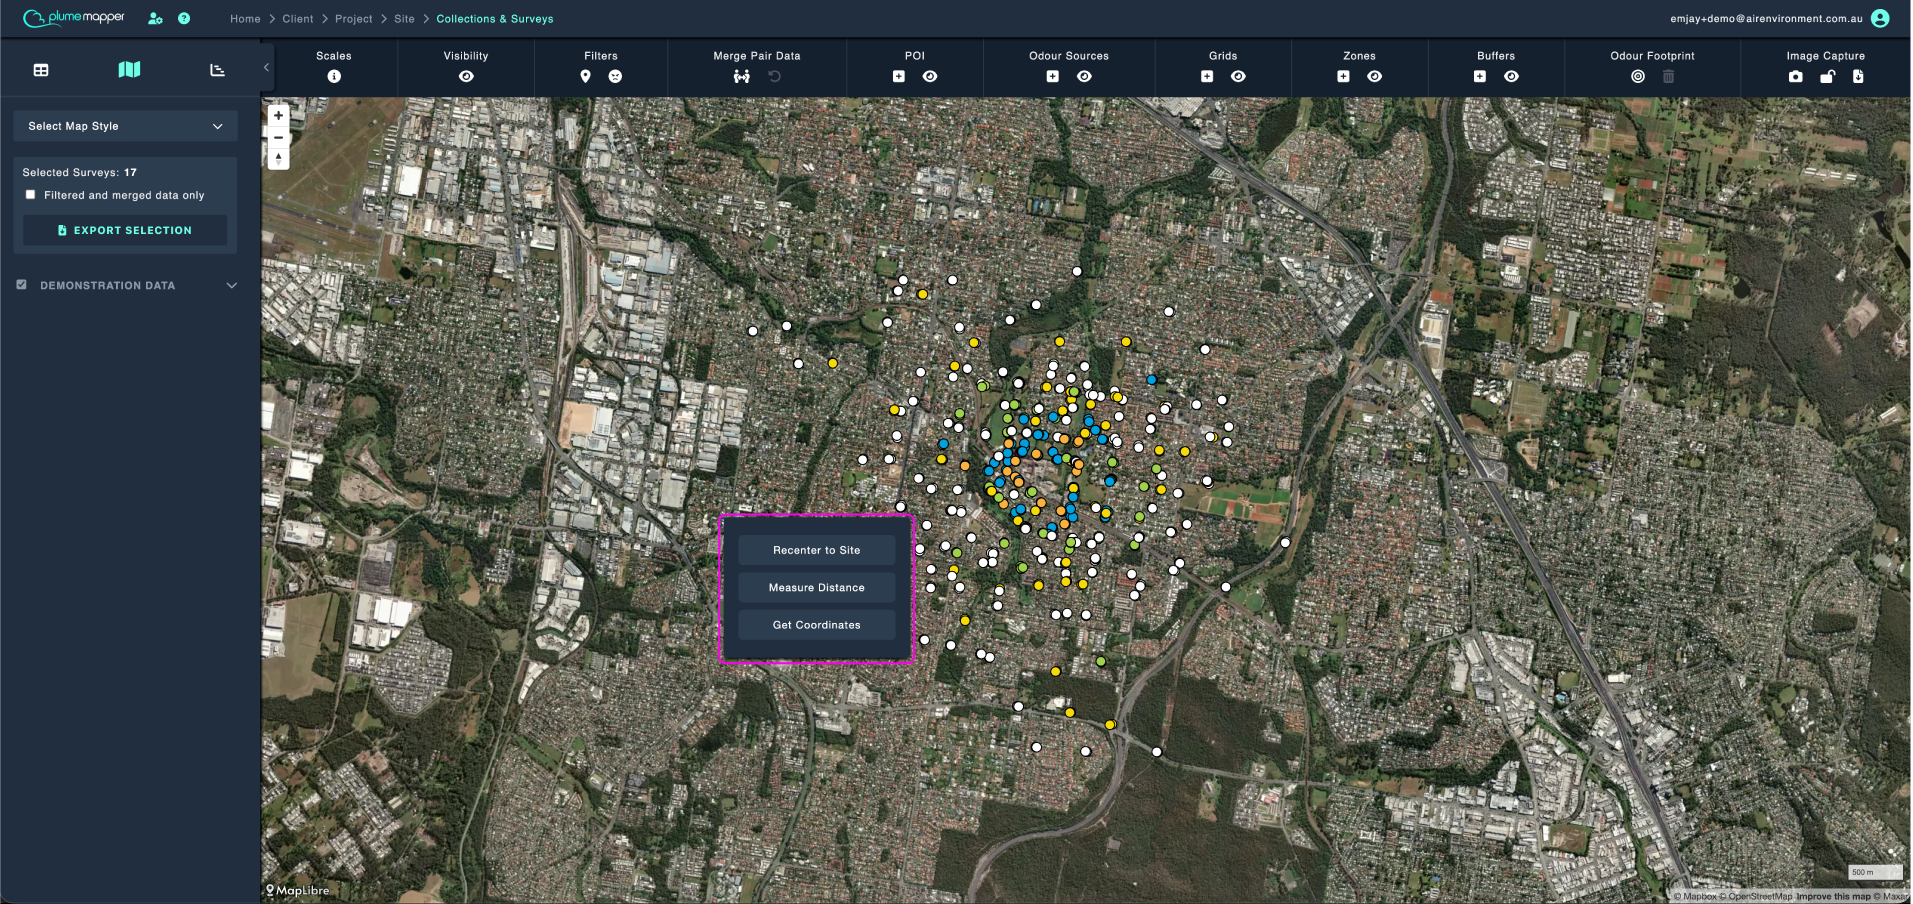
Map View
This screen shows an overview of all the measurement data collected for the open survey collections you selected on the site page.
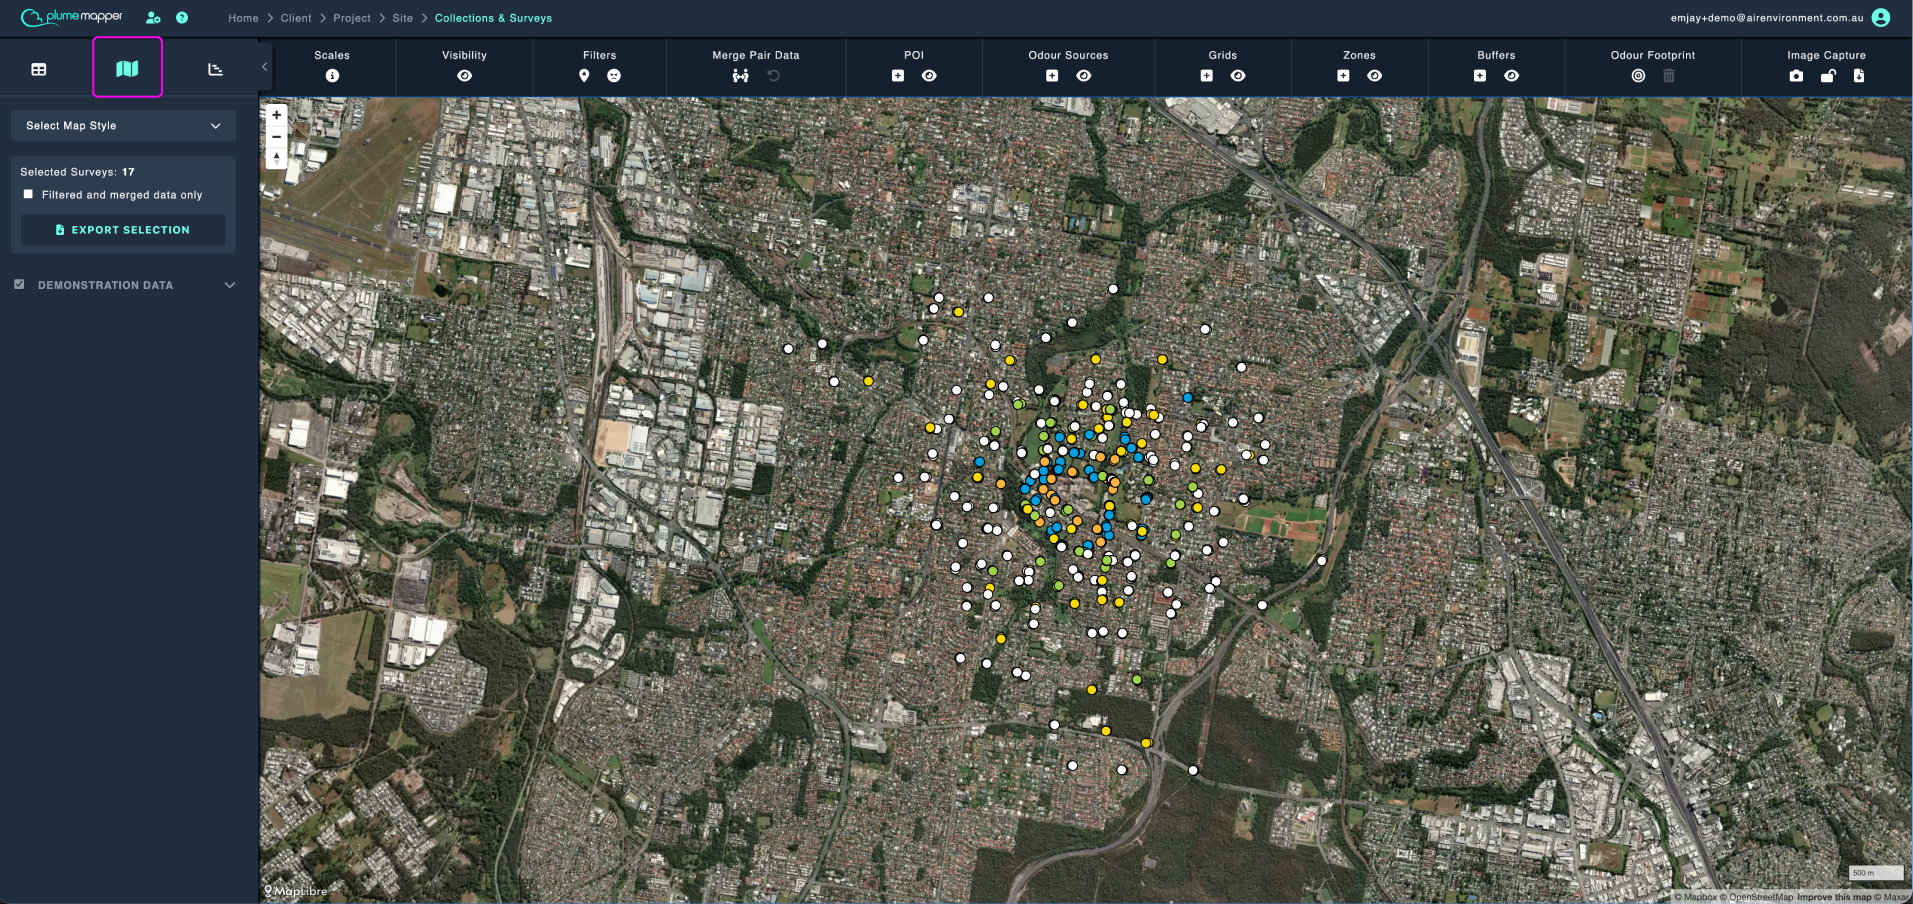
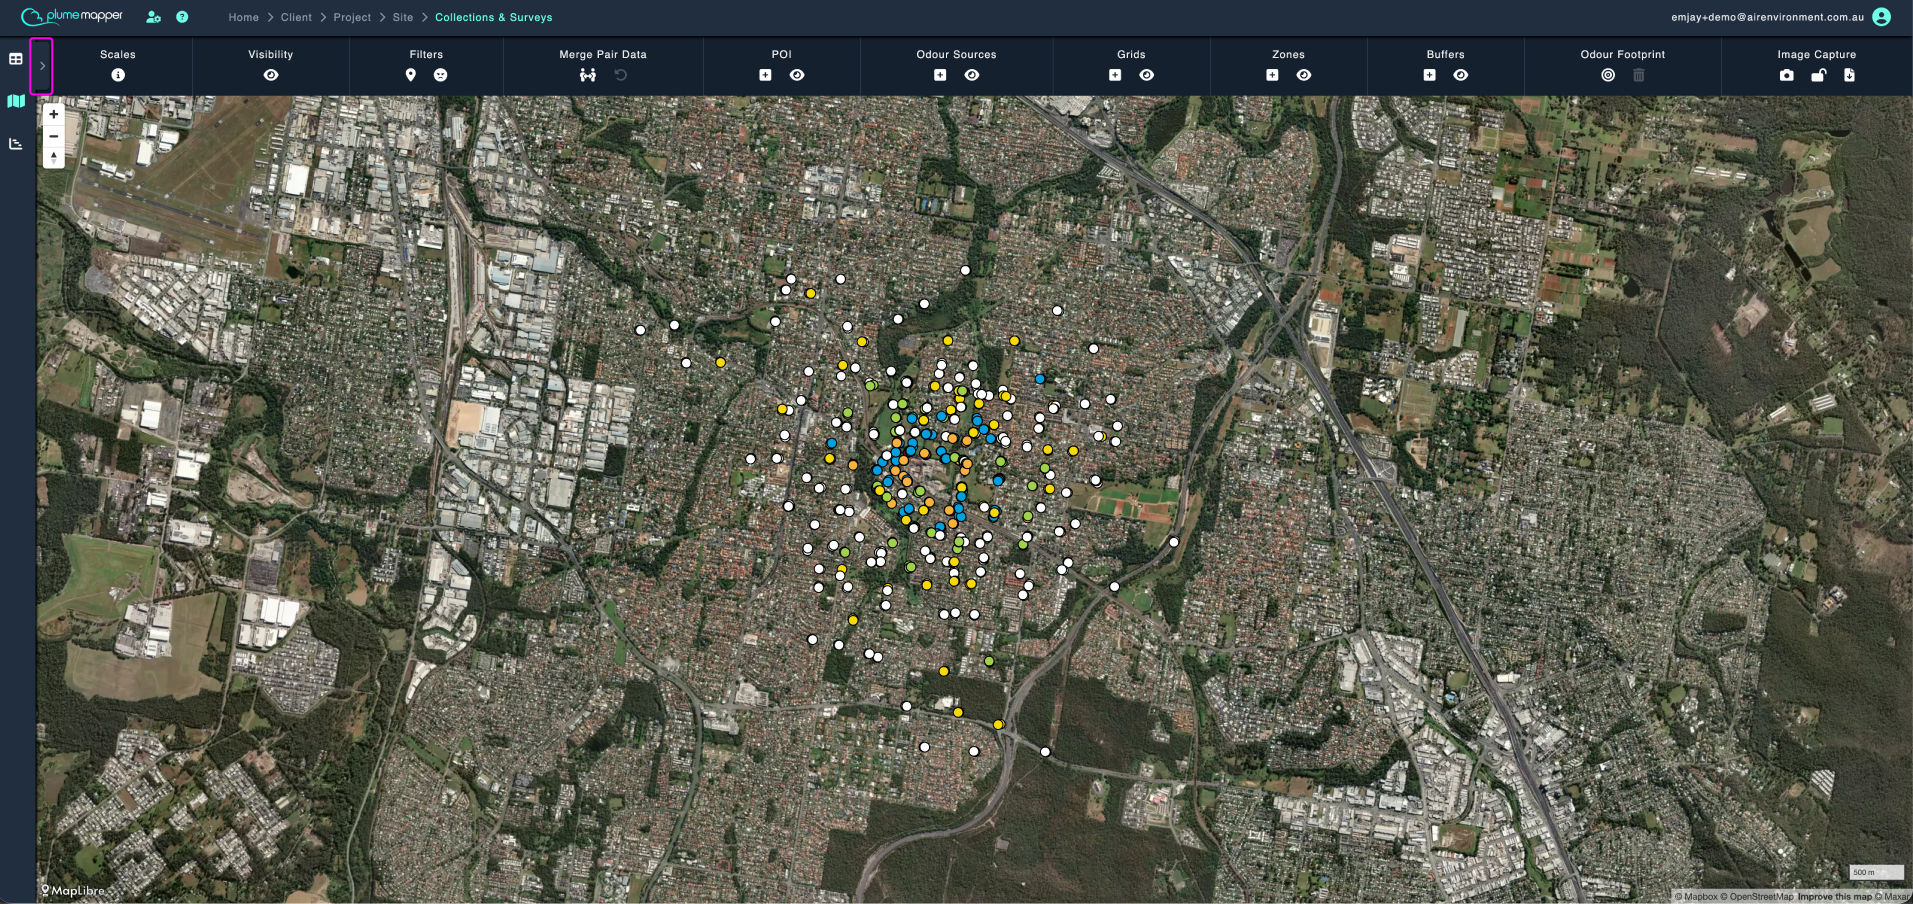
Expand and Collapse Sidebar
Click the tab on the edge of the sidebar to collapse it and give the map more room. Click to bring it back.
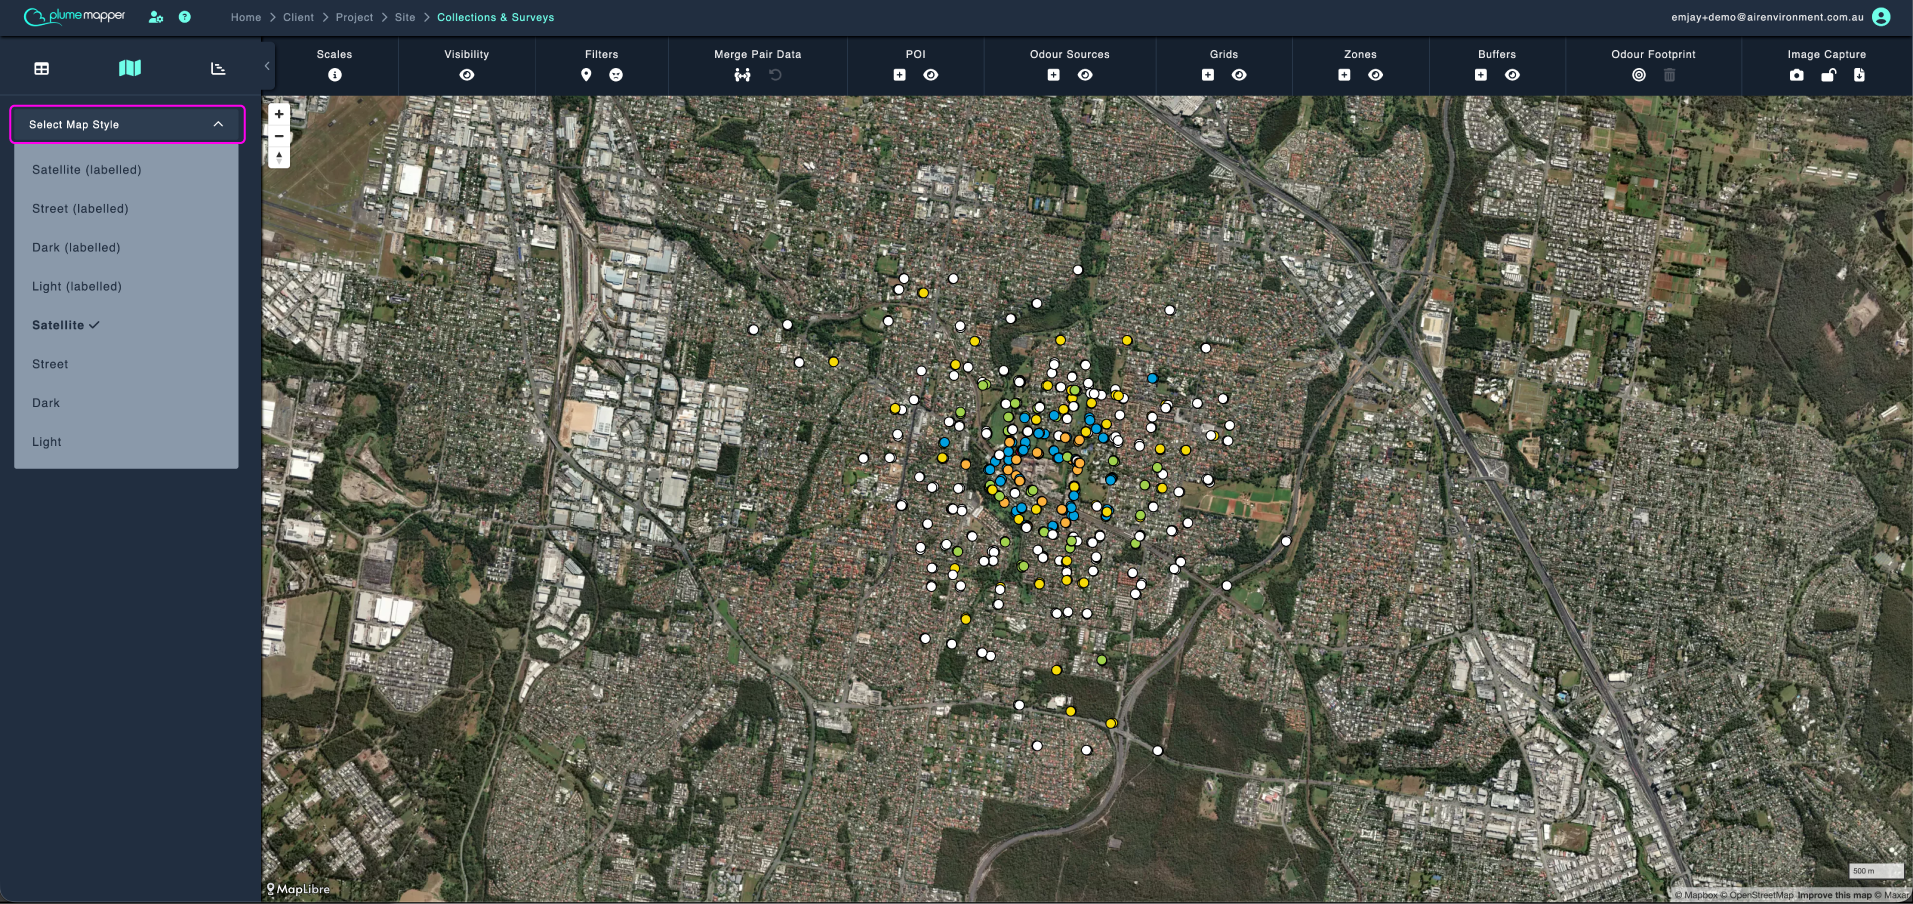
1. Select Map Style
Choose the base-map your data is drawn on. Labelled styles include street names, the plain styles do not.
- Satellite (labelled)
- Street (labelled)
- Dark (labelled)
- Light (labelled)
- Satellite
- Street
- Dark
- Light
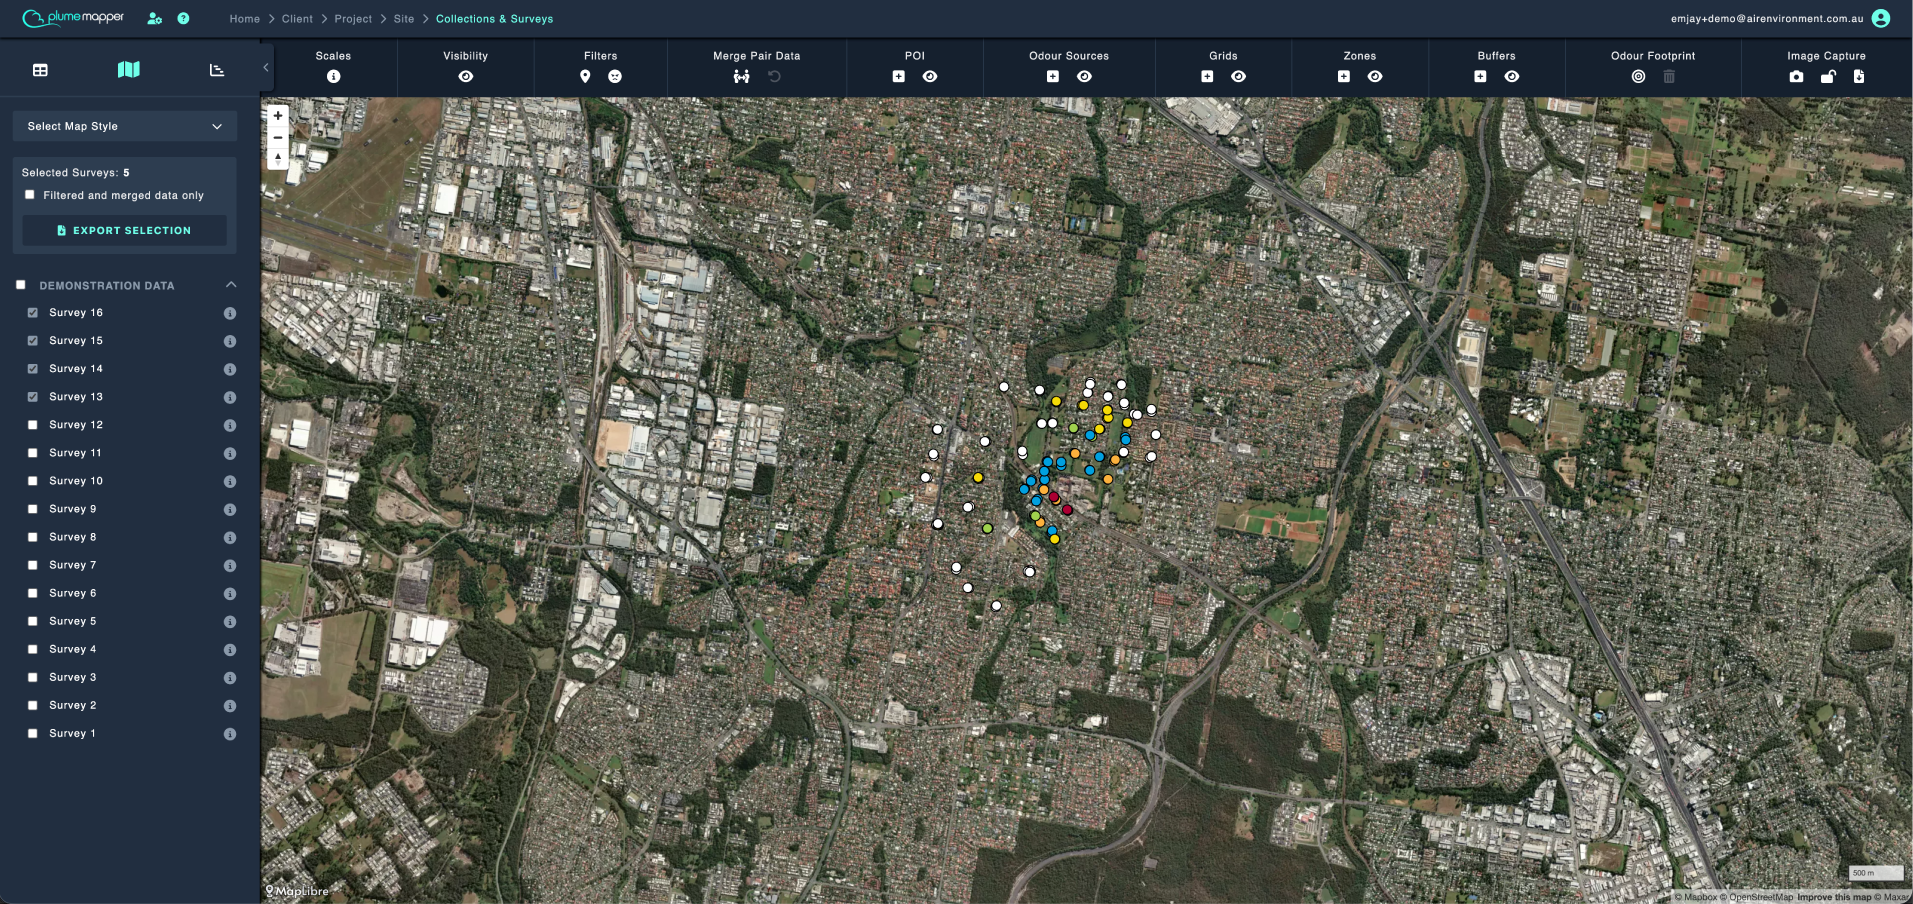
2. Selecting Surveys
The sidebar lists every collection on the site, with the surveys inside it.
- Click a collection name or the icon to expand it.
- Check a survey to add its measurements to the map, uncheck it to remove them.
- Check the box next to the collection name to select every survey in that collection at once.
The number of currently selected surveys is shown above the list.
Note: Only data from checked surveys appears on the map and is used by
3. Survey Info
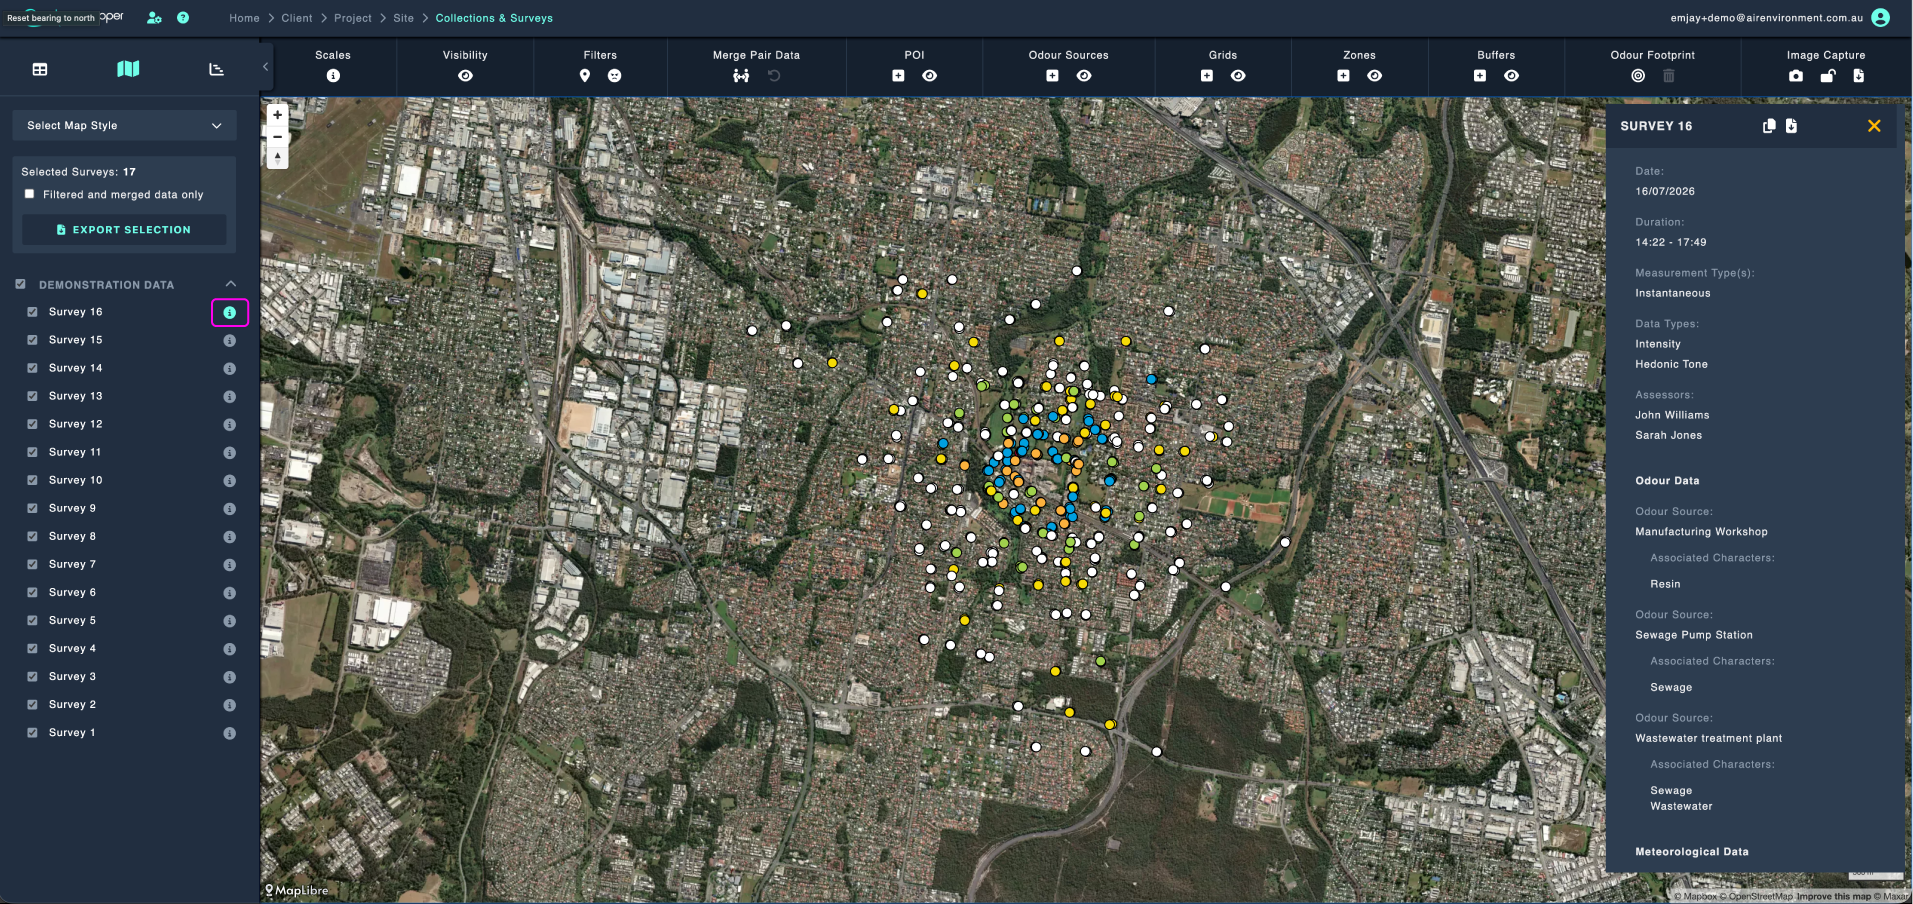
Click the icon next to a survey to open a summary panel for it.
The panel shows:
- Date and duration
- Measurement type(s) and data types
- Assessors
- Each odour source and the characters associated with it
- Wind direction (true north), wind speeds, temperature range, relative humidity range, ambient pressure range and rainfall
copy the whole summary to your clipboard.
download the summary as a CSV.
4. Export Selection
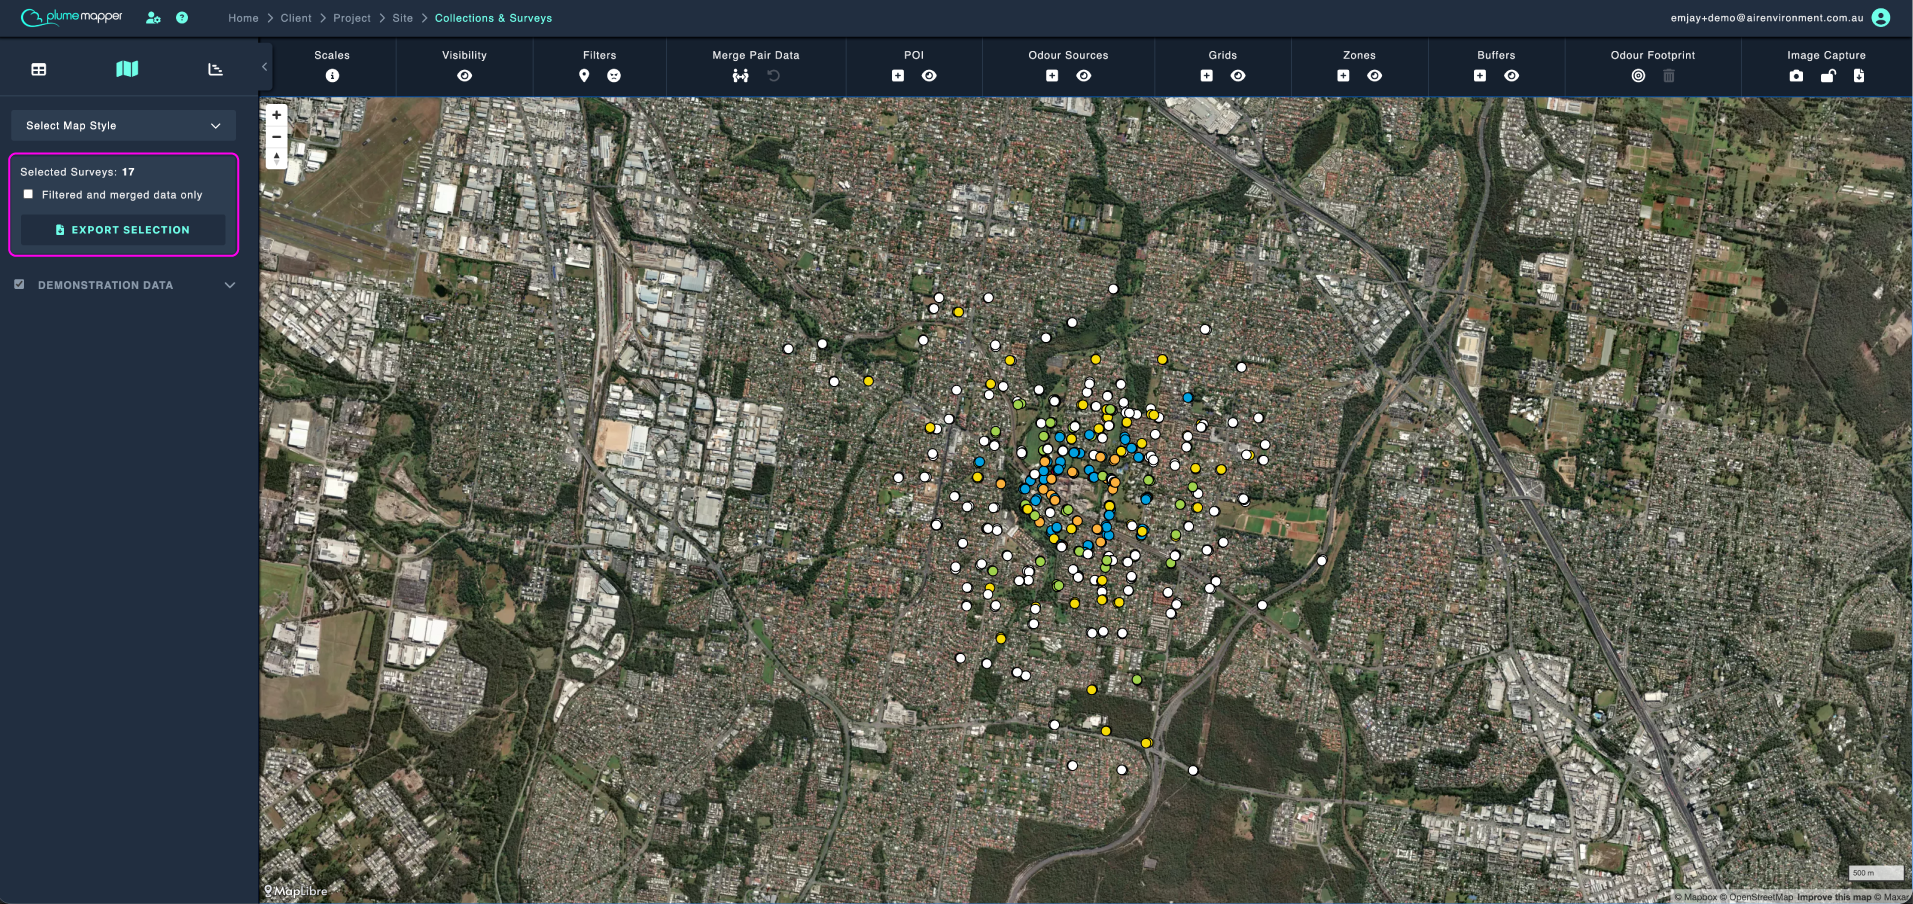
Exports the surveys you have checked in the sidebar.
- By default this downloads the raw survey data, which can be re-imported.
- Check Filtered and merged data only to export just the data currently passing your filters and merge settings, as a CSV.
Important: Filtered and merged data cannot be re-imported.
5. Map Controls
zoom the map in and out.
A scale bar is shown in the bottom right corner, in metric units.
Note: Right click anywhere on the map for more options - see context menu.