
Timed Measurements
Stationary Plume Method.
Create a new timed measurement from the survey map screen, by tapping the button in the bottom menu.
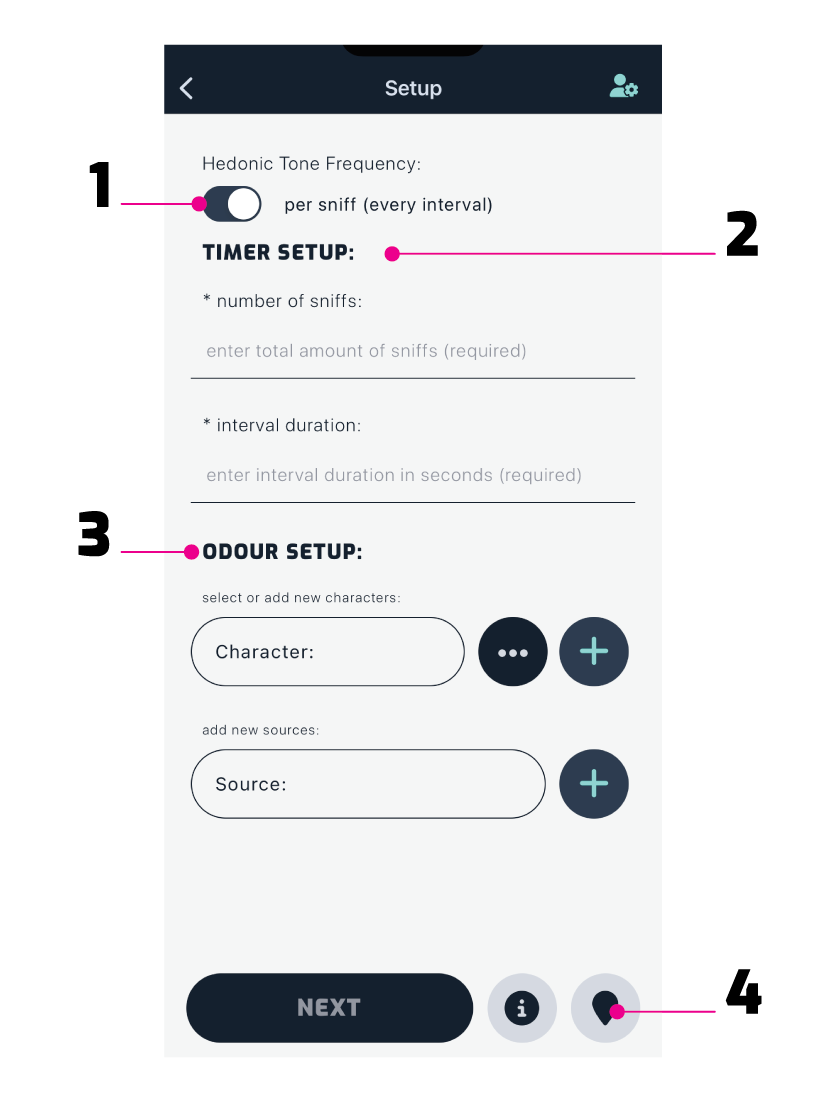
Timer Setup
1. Hedonic Tone Frequency
You can record the hedonic tone either per sniff (every 10 seconds) or at the end of the measurement, after the 10 minutes have elapsed.
2. Timer Setup
Enter the number of sniffs and the interval you want the timer to run on. The recommended usage is 60 sniffs at 10-second intervals over a 10-minute period.
3. Odour Setup
If there are any known odour sources or characters not already recorded on the site, you can add them here and they’ll then populate the dropdowns on the timer screen.
4. Measurement Location
In GPS mode, the measurement location is where your GPS location marker sits on the survey map.
Since GPS can be inaccurate, you can update the measurement location by panning the map until the marker is correctly positioned, then tap Update.
Note: This map automatically pops up if the location wasn’t populated, or if another measurement is within 0.5m of an existing measurement point.
Syncing Site Data
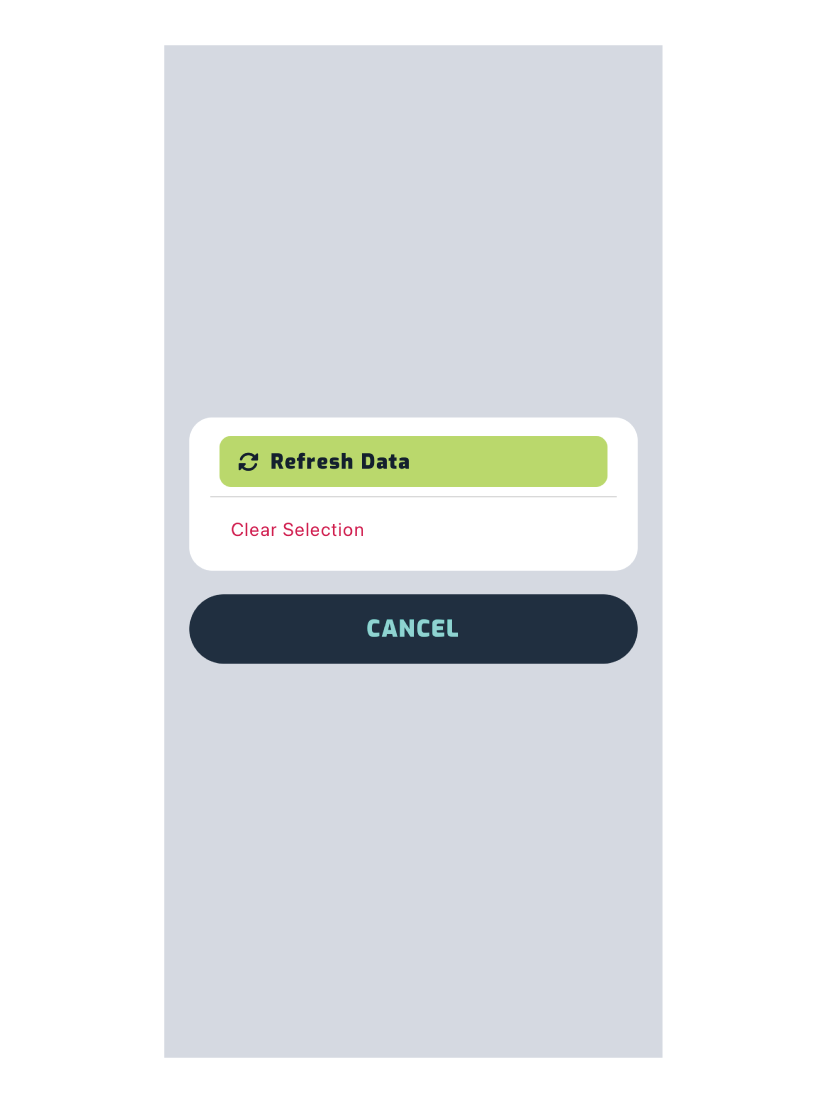
When you select an associated grid point, character or source from the dropdowns, you’ll see a Refresh Data button, as shown below.
If another assessor has added a new source, character or grid point and it doesn’t appear in your dropdown, tap Refresh Data to update the list.
Note: The button can only be tapped once every minute.
Weather Conditions
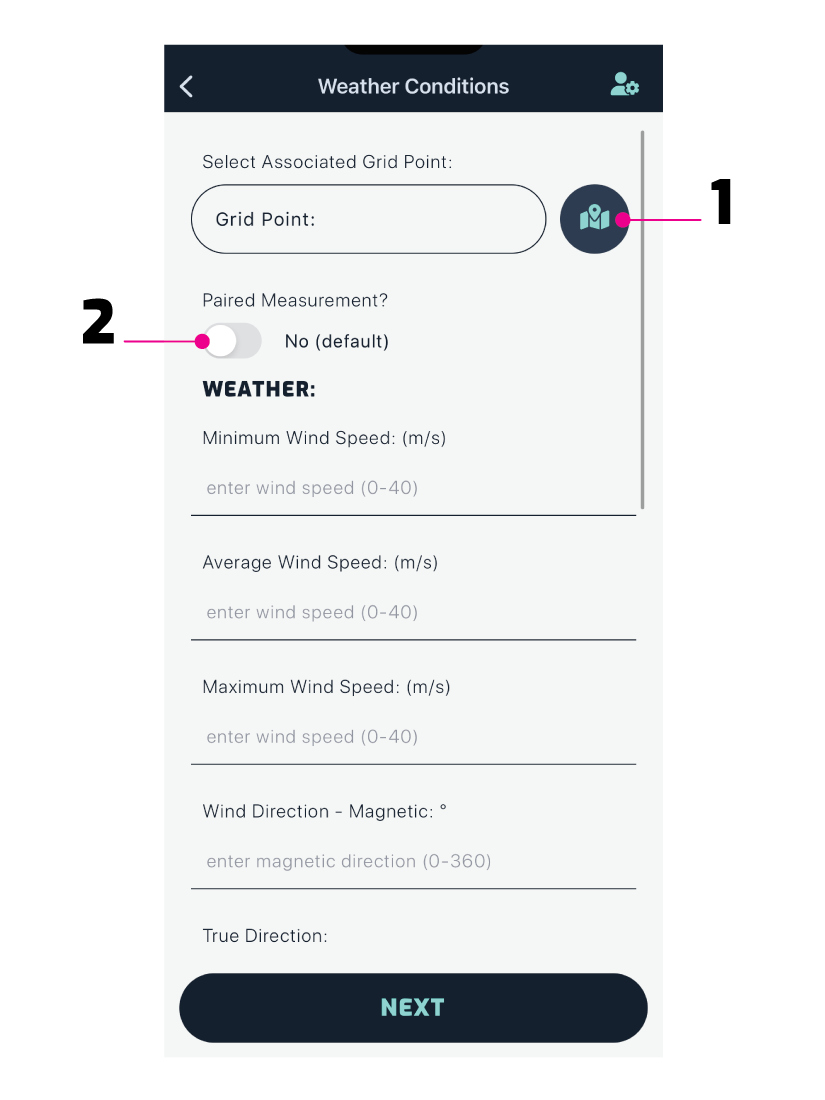
1. Paired Measurement
By default a measurement is unpaired. If you are collecting paired data, toggle the switch to yes. A dropdown appears with a list of all the surveyors in the field - select the person you are working with and continue.
Important: You and your partner must use the same pair ID for each paired measurement, otherwise merging measurements at the analysis stage will not work. Manage this by incrementing (+) or decrementing (-) the ID.
2. Associated Grid Point
When using grids, this is how you identify a measurement associated with a specific grid point (location).
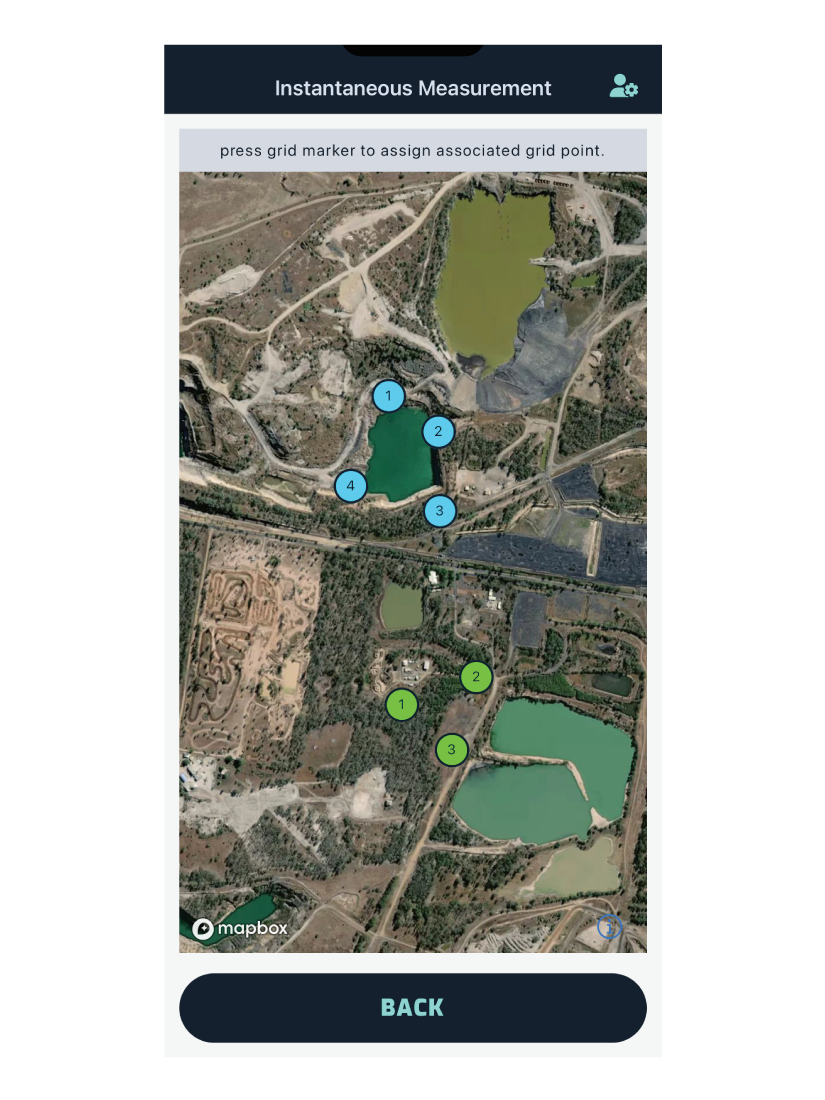
Select the grid point ID from the dropdown menu, or tap the button to bring up a map with all grid points, as shown below. Select the associated point by tapping it.
Note: This feature only appears if the site has transect grids set up.
3. Compass
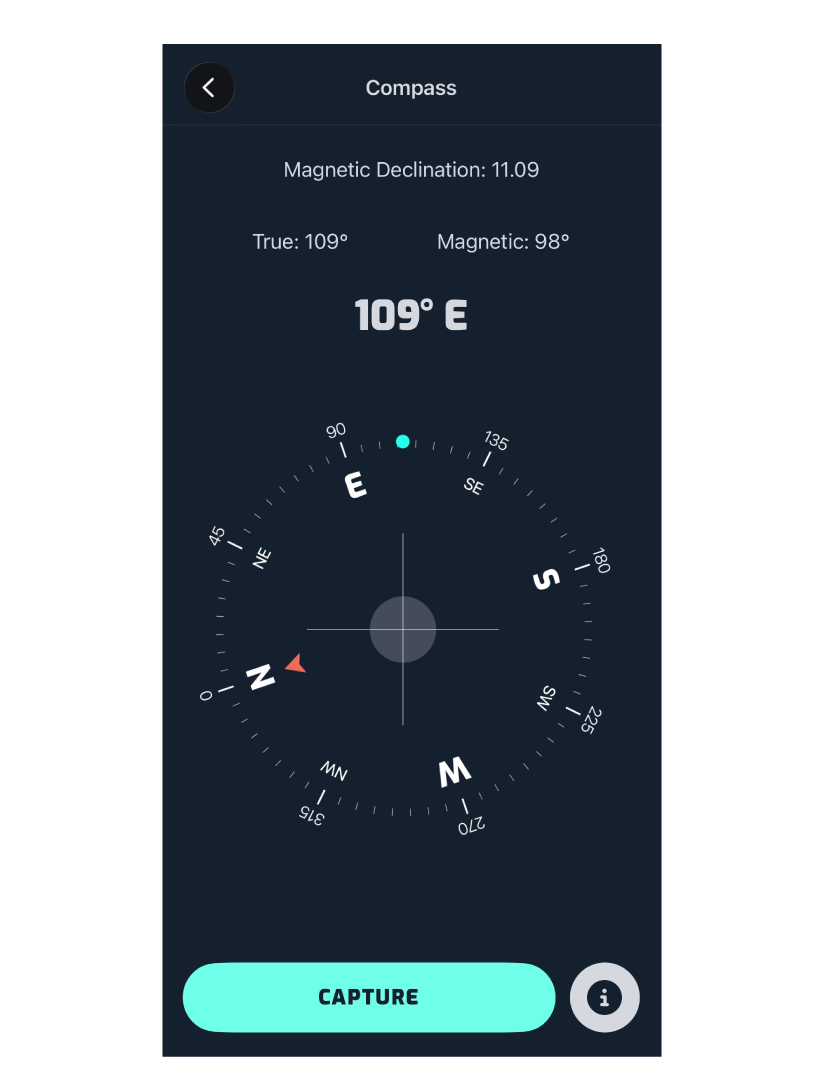
Tap Compass to open the compass and see your current direction aligned to True North.
Tap Capture to automatically fill both the Magnetic and True direction fields in your measurement form.
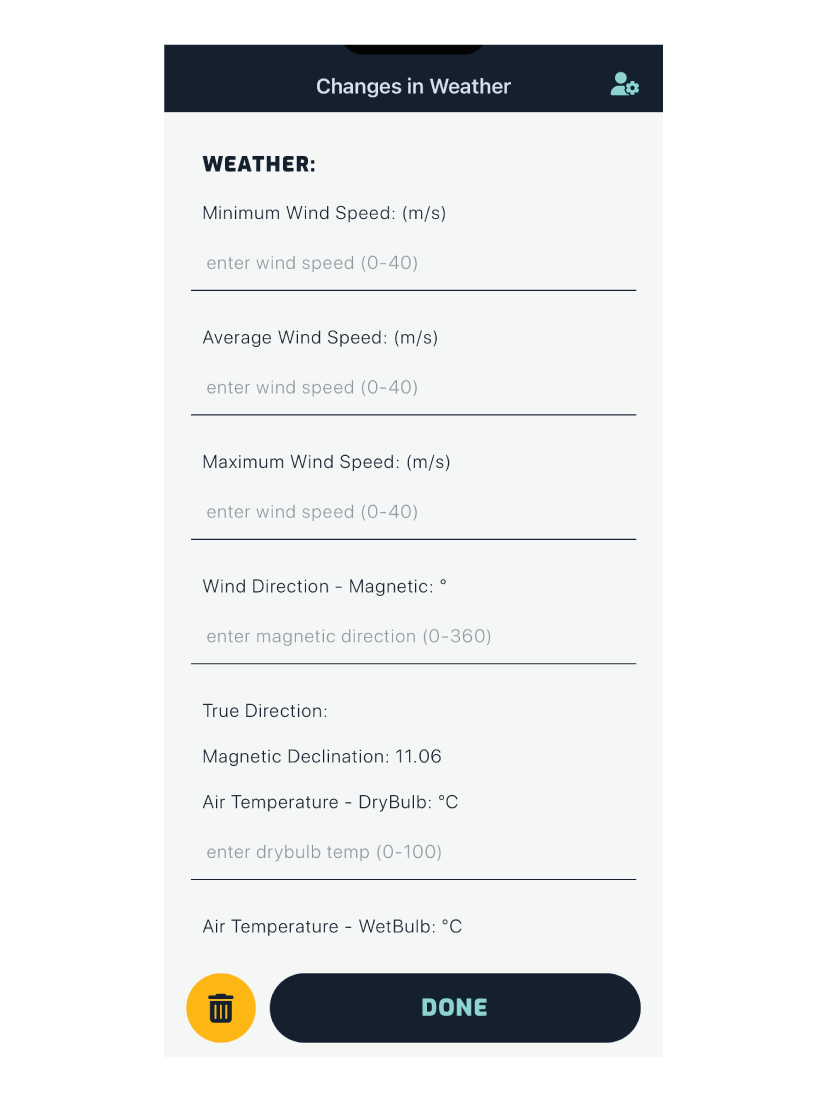
Weather Data
In the weather section, you can enter weather conditions such as:
- Wind Speed - Minimum, Average, Maximum.
- Wind Direction - Magnetic, and True (automated when magnetic direction is entered).
- Temperature - WetBulb, DryBulb.
- Rain & Cloud - Precipitation, Cloud Coverage, Cloud Type.
- Other - Surface atmospheric pressure (hPa), Relative humidity.
Timer
As soon as you tap Start, the timer starts counting down and you should start sniffing.
After 3 seconds, a vibration indicates the end of the sniffing period. The remaining 7 seconds are for you to enter the intensity, hedonic tone and odour source/character.
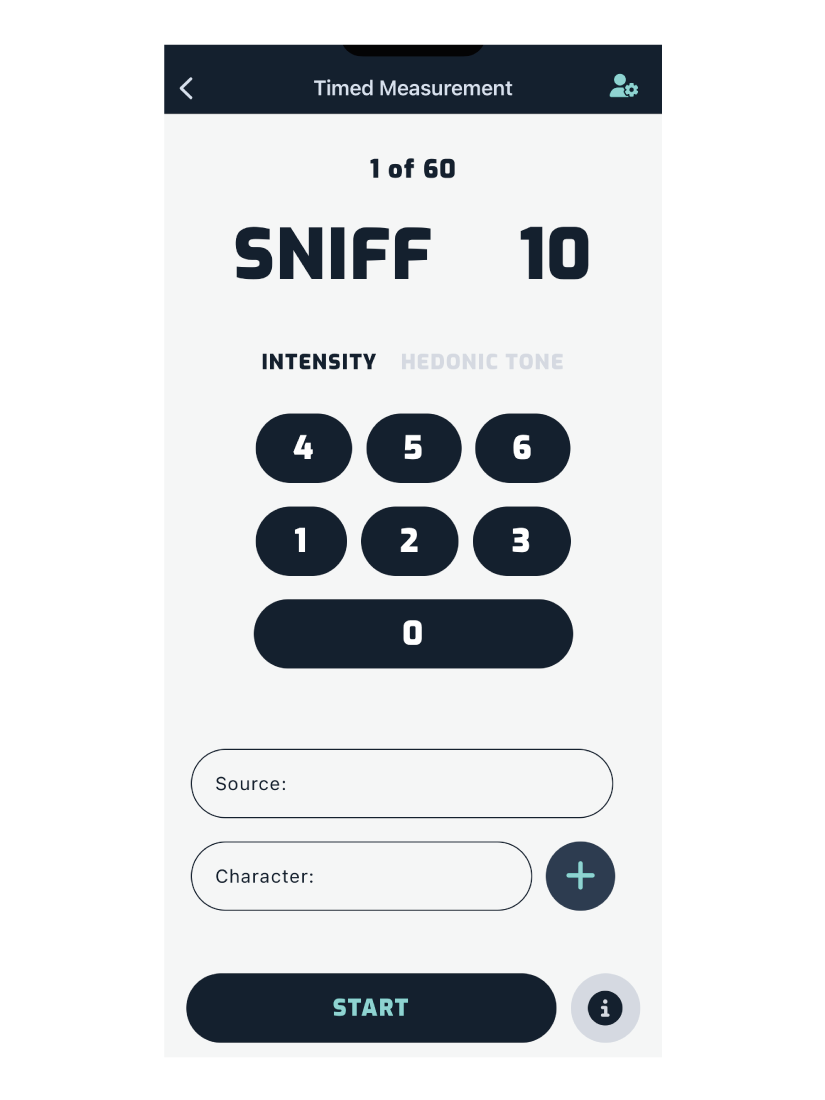
Once the intensity has been selected, the number pad switches to hedonic tone, as shown below.
Note: When a selection has been made, the button turns green.
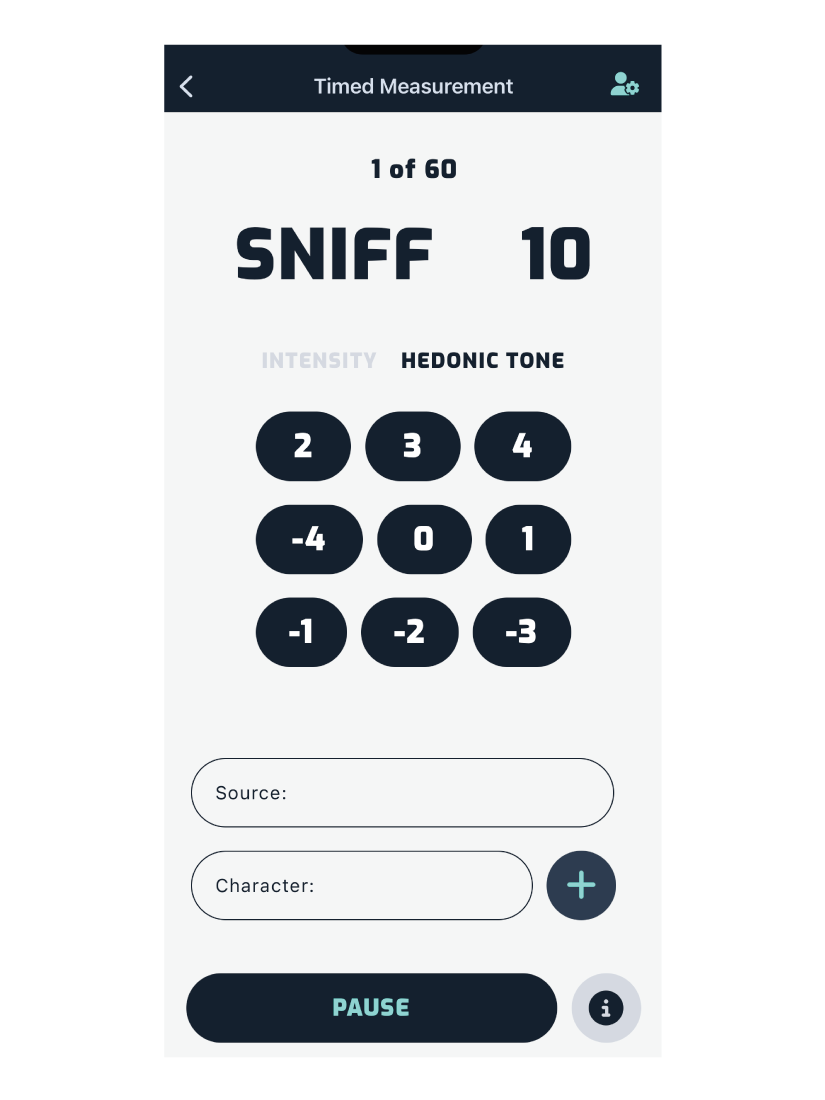
Note: When adding a new character by tapping the button, the timer pauses until the character has been saved. You can pause and restart the timer at any point, but this means the measurement will exceed the 10-minute duration.
Summary
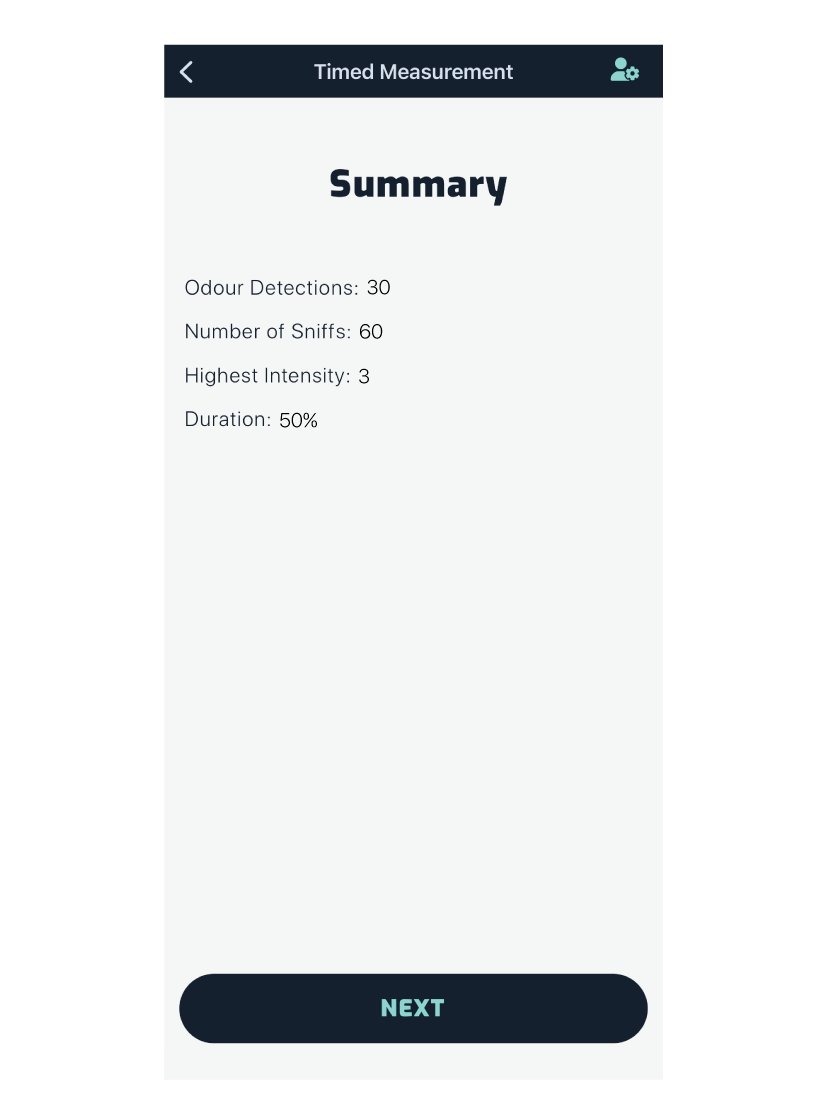
Once the 60 sniffs have been completed, a summary of the data is displayed:
- Amount of detected intensities recorded
- Total number of sniffs
- The highest intensity level
- The duration of detections
Changes in Weather
You can record any updates to weather conditions here before completing the measurement.
Changes in Weather - Recording Pollutant Data
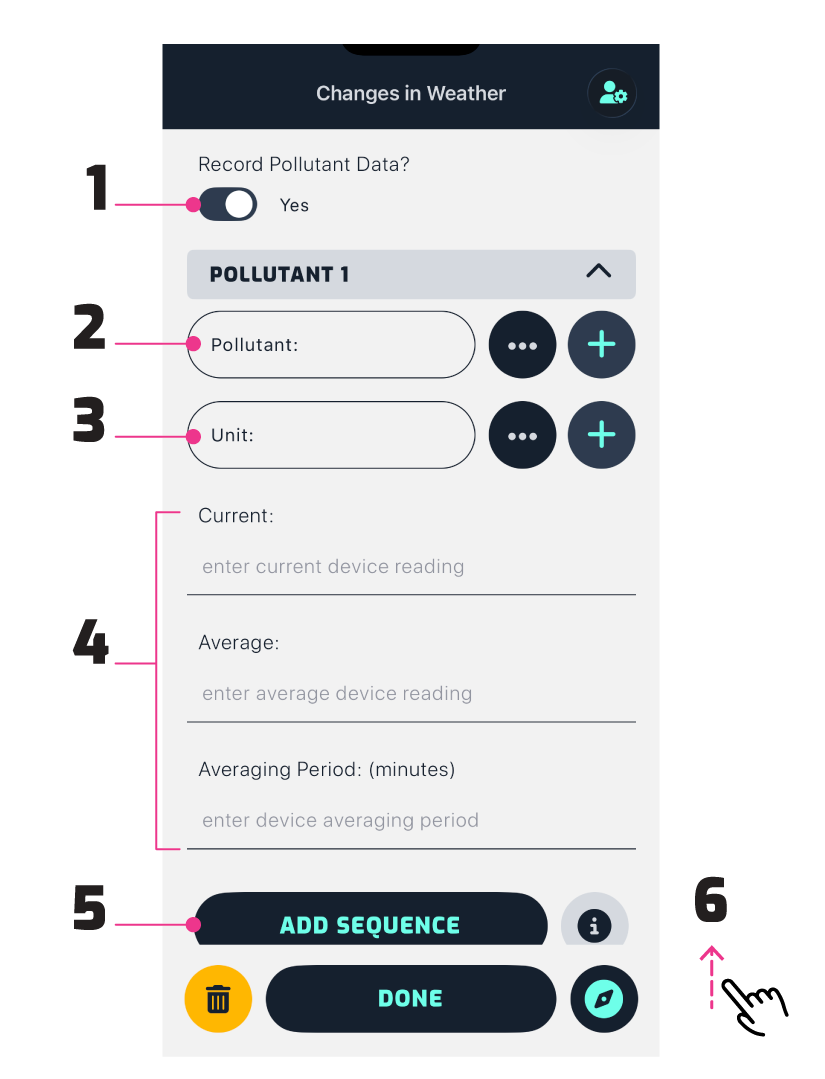
1. Are Pollutants Present?
By default the pollutant status is no. If a pollutant is present, toggle the switch to yes. This reveals the pollutant form, as shown above.
2. The Type of Pollutant
To select from a pre-defined pollutant list (below), tap the button. To add a new pollutant, tap the button and enter the name of the pollutant.
When you select an option from the dropdown, the unit of measurement is filled in automatically. Previously used pollutant-unit pairs are saved, so you can quickly reuse them.
- Ammonia
- Carbon dioxide
- Carbon disulfide
- Carbon monoxide
- Dimethyl disulfide
- Dimethyl sulfide
- Hydrogen sulfide
- Nitrogen dioxide
- Oxygen
- Ozone
- Particles PM10
- Particles PM2.5
- Particles Total
- Sulfur dioxide
- Total volatile organic compounds
3. The Unit of Measurement
To select from a pre-defined list of units (below), tap the button. To add a new unit of measurement, tap the button and enter the name of the unit.
- ppb
- pphm
- ppm
- µg/m3
- mg/m3
- %
4. The Reading
The fields you fill in depend on the device you are using to record pollutant data:
- Current reading
- Average reading
- Averaging period
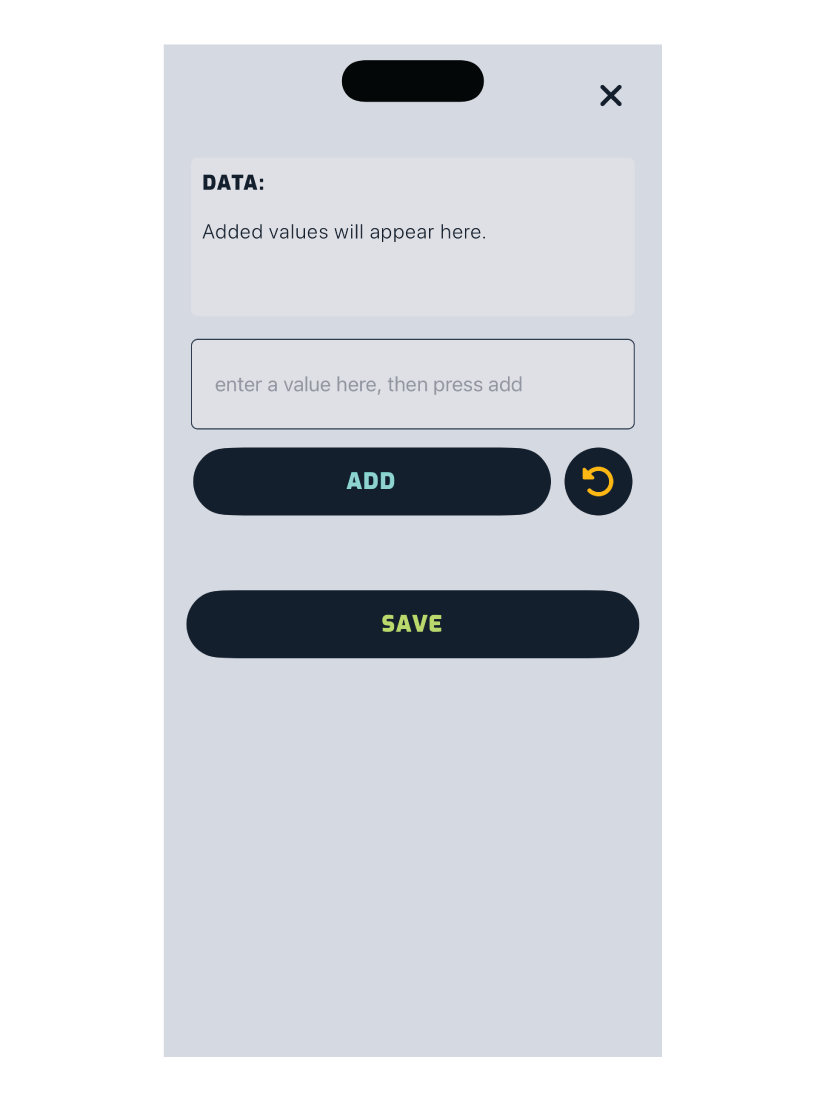
5. A Sequence of Readings
To add a sequence of readings, enter a reading in the input field above the add button, then tap Add. You can only enter one reading at a time.
Each reading shows in the box above the input field. Remove the last reading you entered by tapping the button.
Once you have finished adding all the readings, tap Save to return to the measurement screen.
6. Recording Multiple Pollutants
If there are multiple pollutants, tap the button after recording each one.
Each pollutant entry populates a form; you can review and delete each pollutant entry.
Tap Done when complete and the measurement will appear on the survey map screen.