Creating and Editing Grids
This feature is accessed via the sidebar navigation on the survey map.
Grids and grid points; not to be be mistaken for the German Grid Method, are static locations that measurements are collected at.
For example, if you have a team that frequents designated locations, you can plot them on a map to guide assessors to the exact position/s.
You can have multiple grids on a site, each will be named and coloured uniquely.
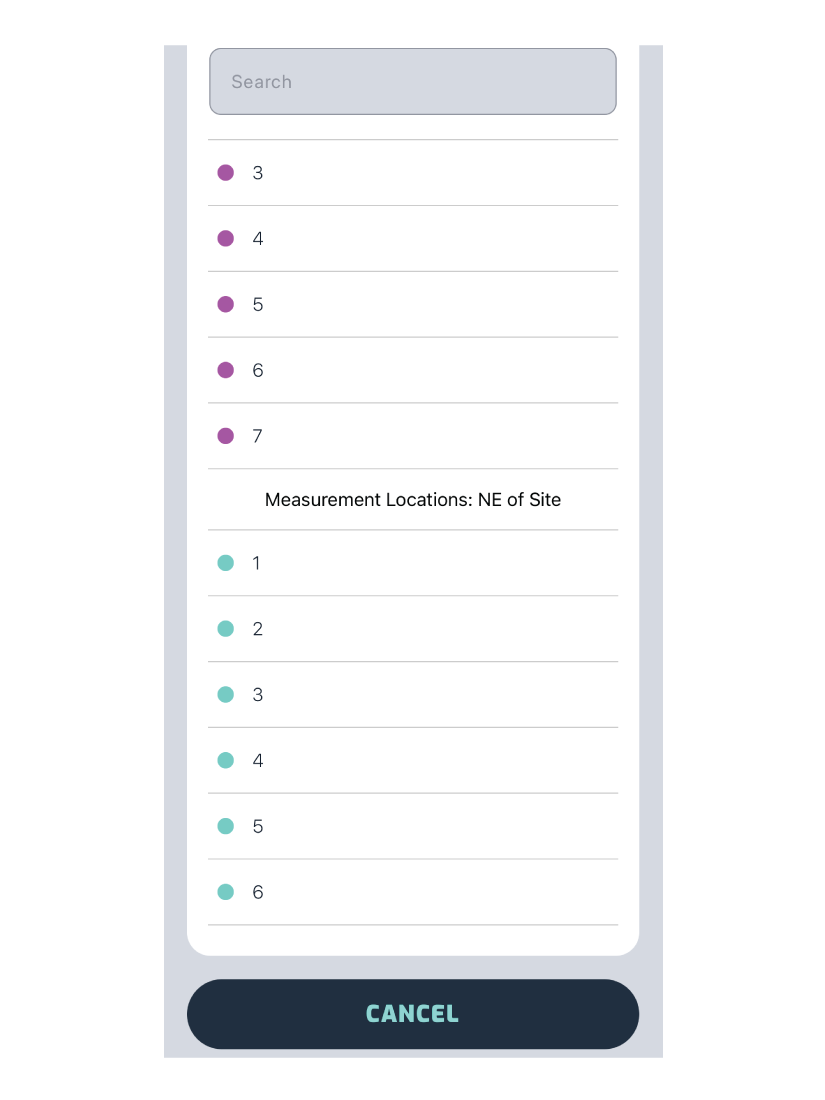
Above is an example of how the grid data will be populated in the Associated Grid Point dropdown menu, when adding a new measurement.
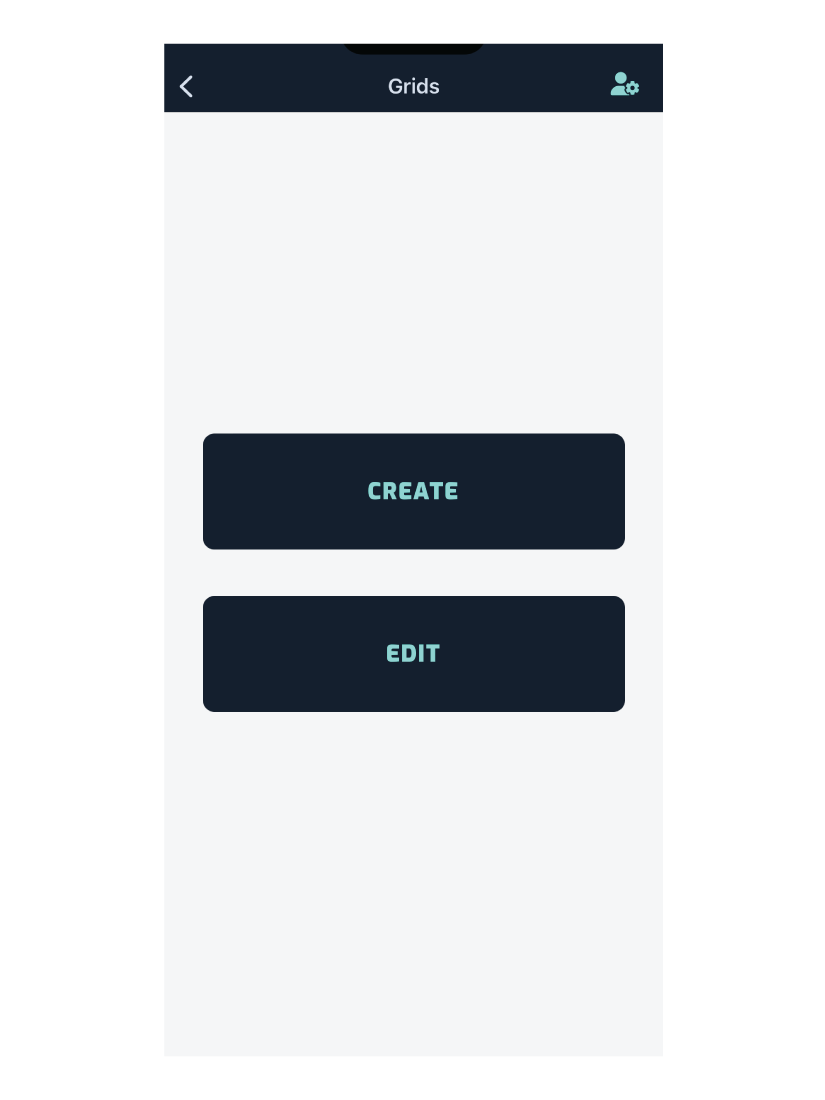
Creating a New Grid
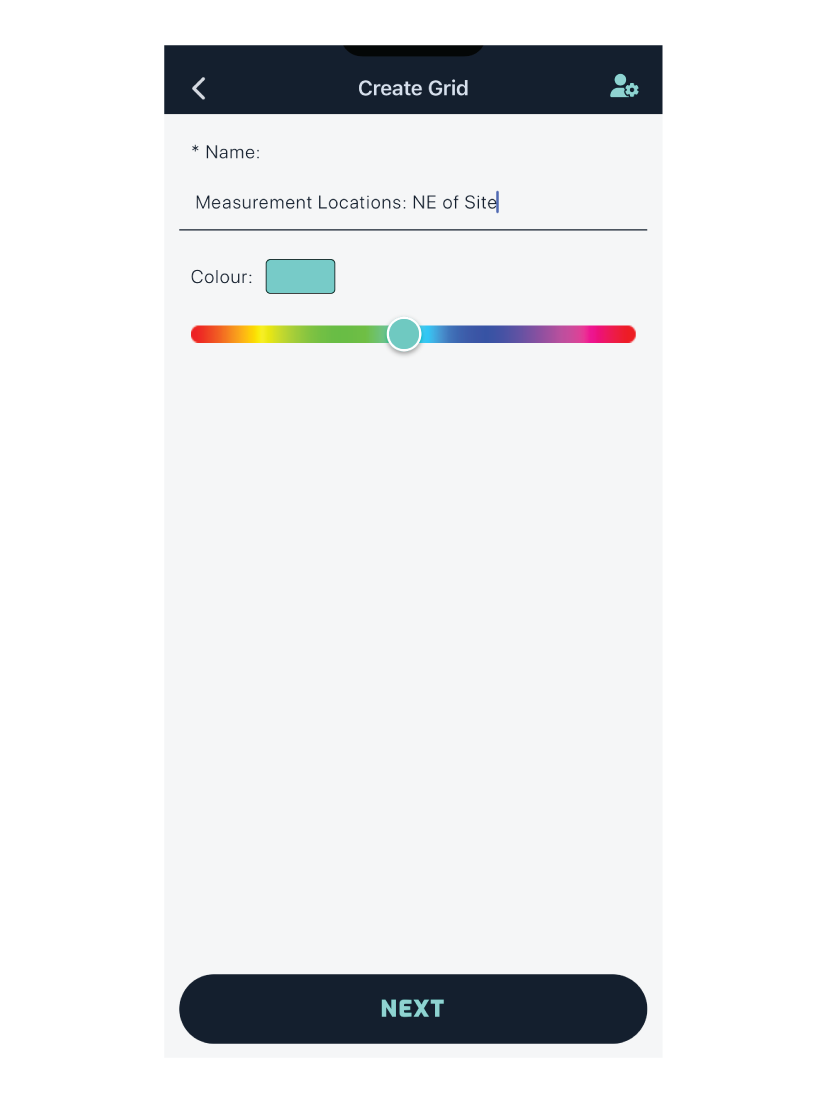
Simply add a name and colour for the grid and press next.
Note: *Grid names must be unique per site.*
Plotting Points
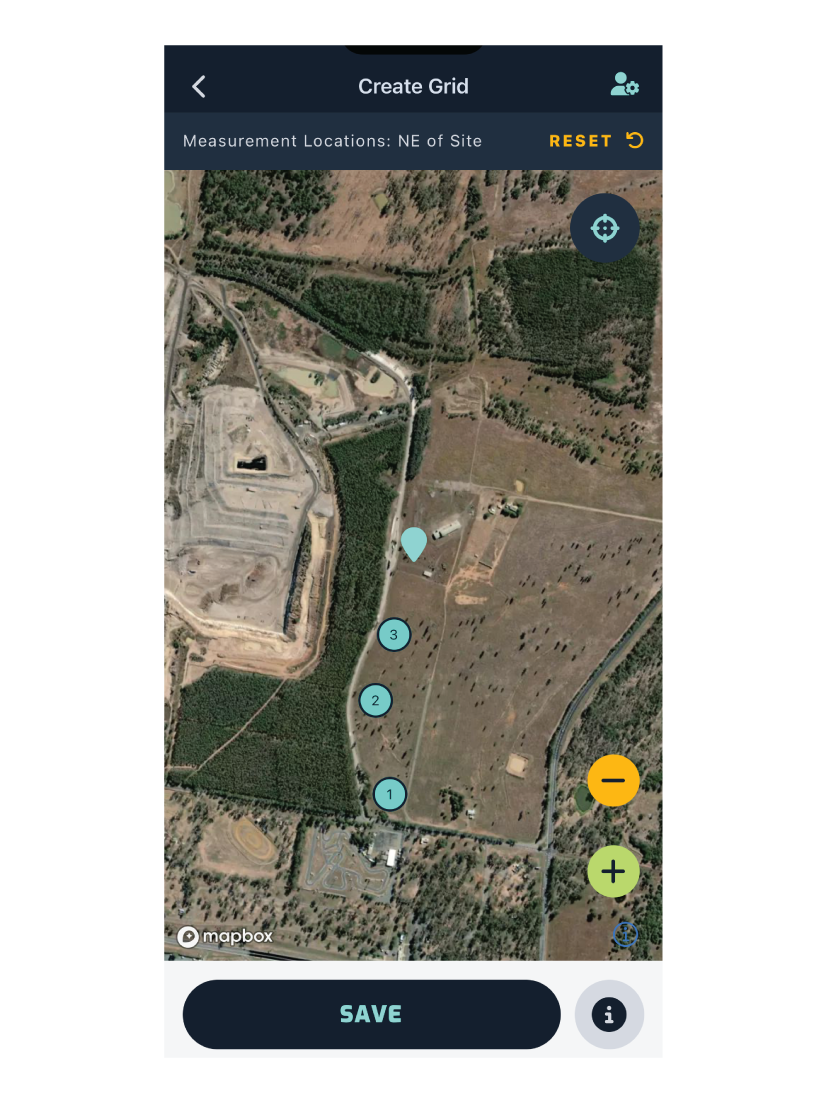
Drag the map until the marker is positioned where the grid point should be. Then press the button to plot the point.
Pressing the button will remove the last point that was added, you can also reset (clear all points) the entire grid by pressing reset.
Editing Points
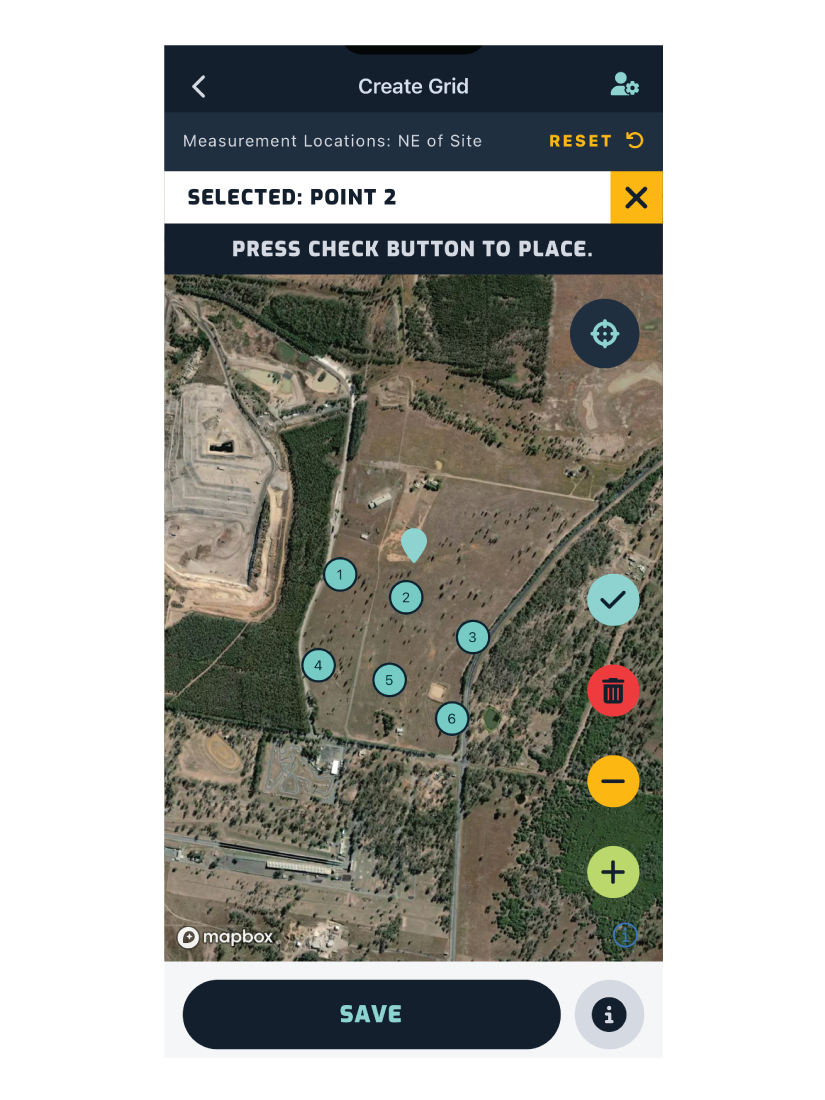
To adjust the position of a plotted point, press on the point you want to edit. It will then show you which point has been selected at the top of the map. You can deselect it by pressing the button.
Editing the location is the same process as adding a point, drag the map until the marker is positioned where the grid point should be. then press the button to update the position.
You can delete a point anywhere on the map by pressing the button on the selected point.
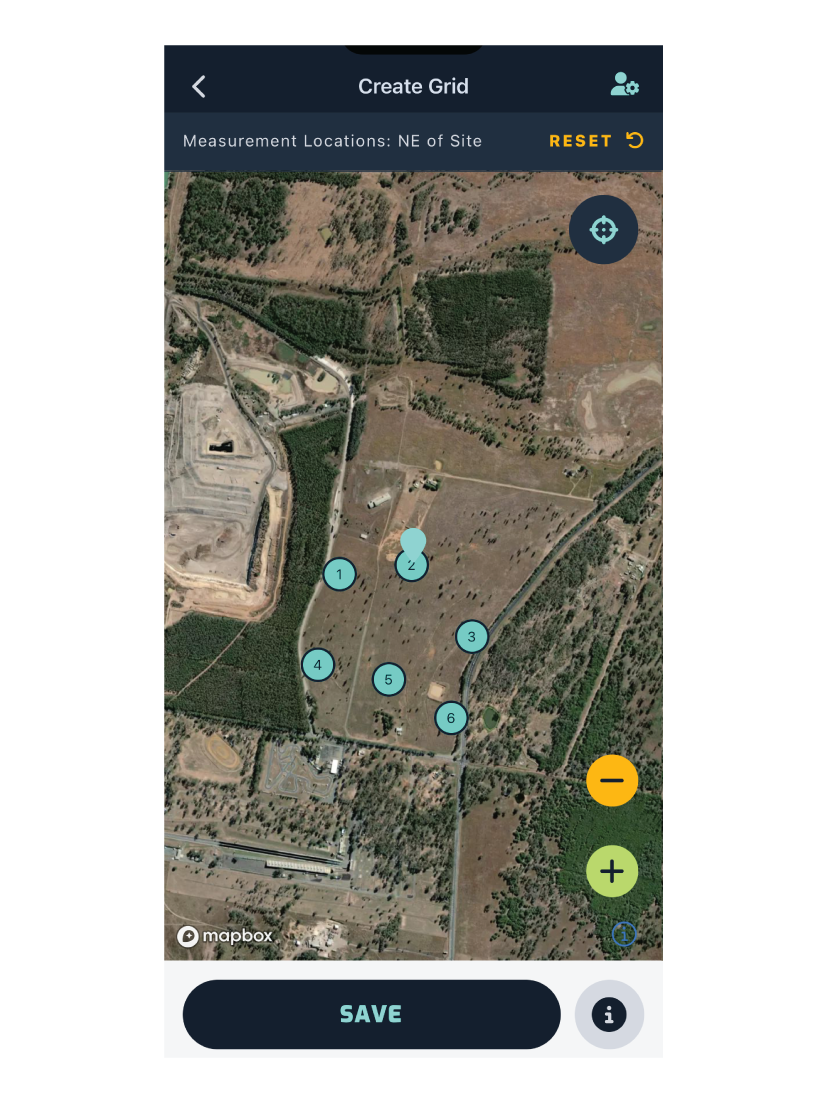
After updating or deleting a point, the point is deselected and you can continue adding more points.
Edit an Existing Grid
To edit an existing grid, select the grid from the dropdown menu, shown below.
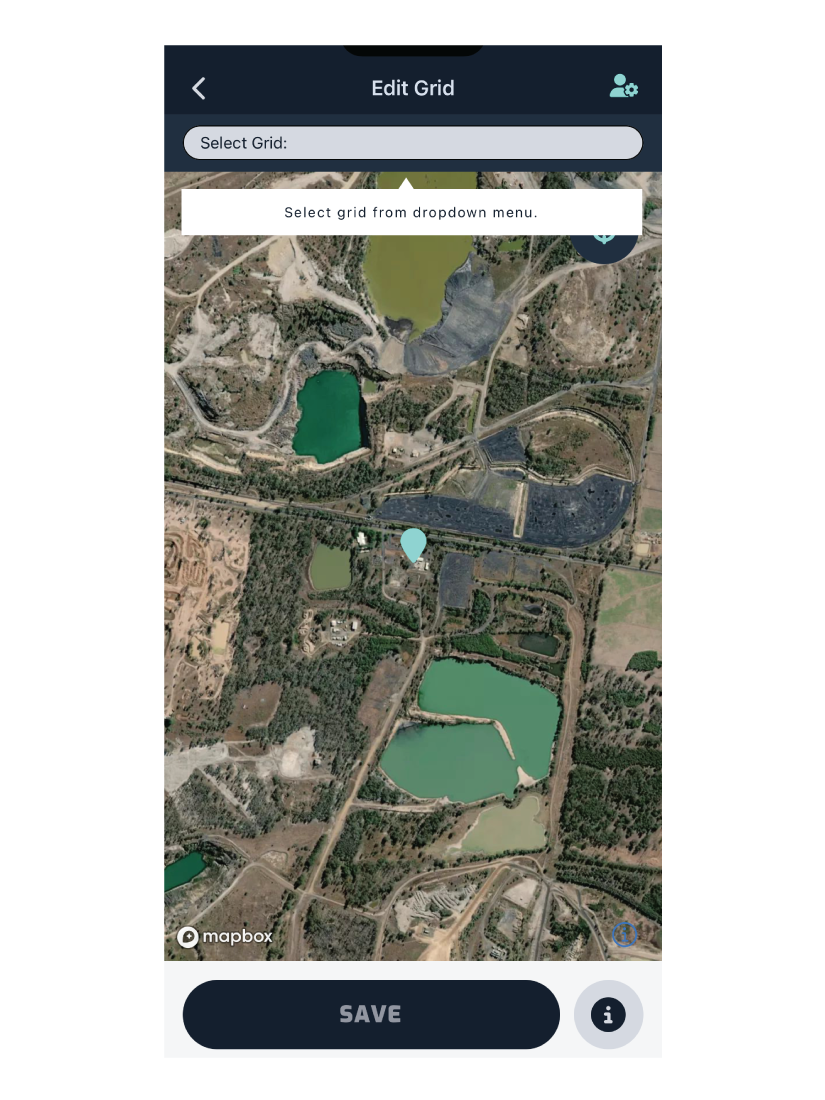
Editing a grid is the same process as editing the points (as described above). Select a point to edit or delete it, or add new points to the grid using the button.