Map Feature Visibility
There are two ways to control what is visible on the map.
1. Through the Visibility panel.
2. Via the feature list.

1. Through the Visibility panel, next to filtering.
This a quick toggle option to easily switch the visibility state of:
1.a. Marker colours, by scale.
This will control the colour of the measurement markers.
- The highest intensity recorded within the measurement data (default).
- The highest hedonic tone recorded within the measurement data.
- The highest pollutant value recorded within the measurement data.
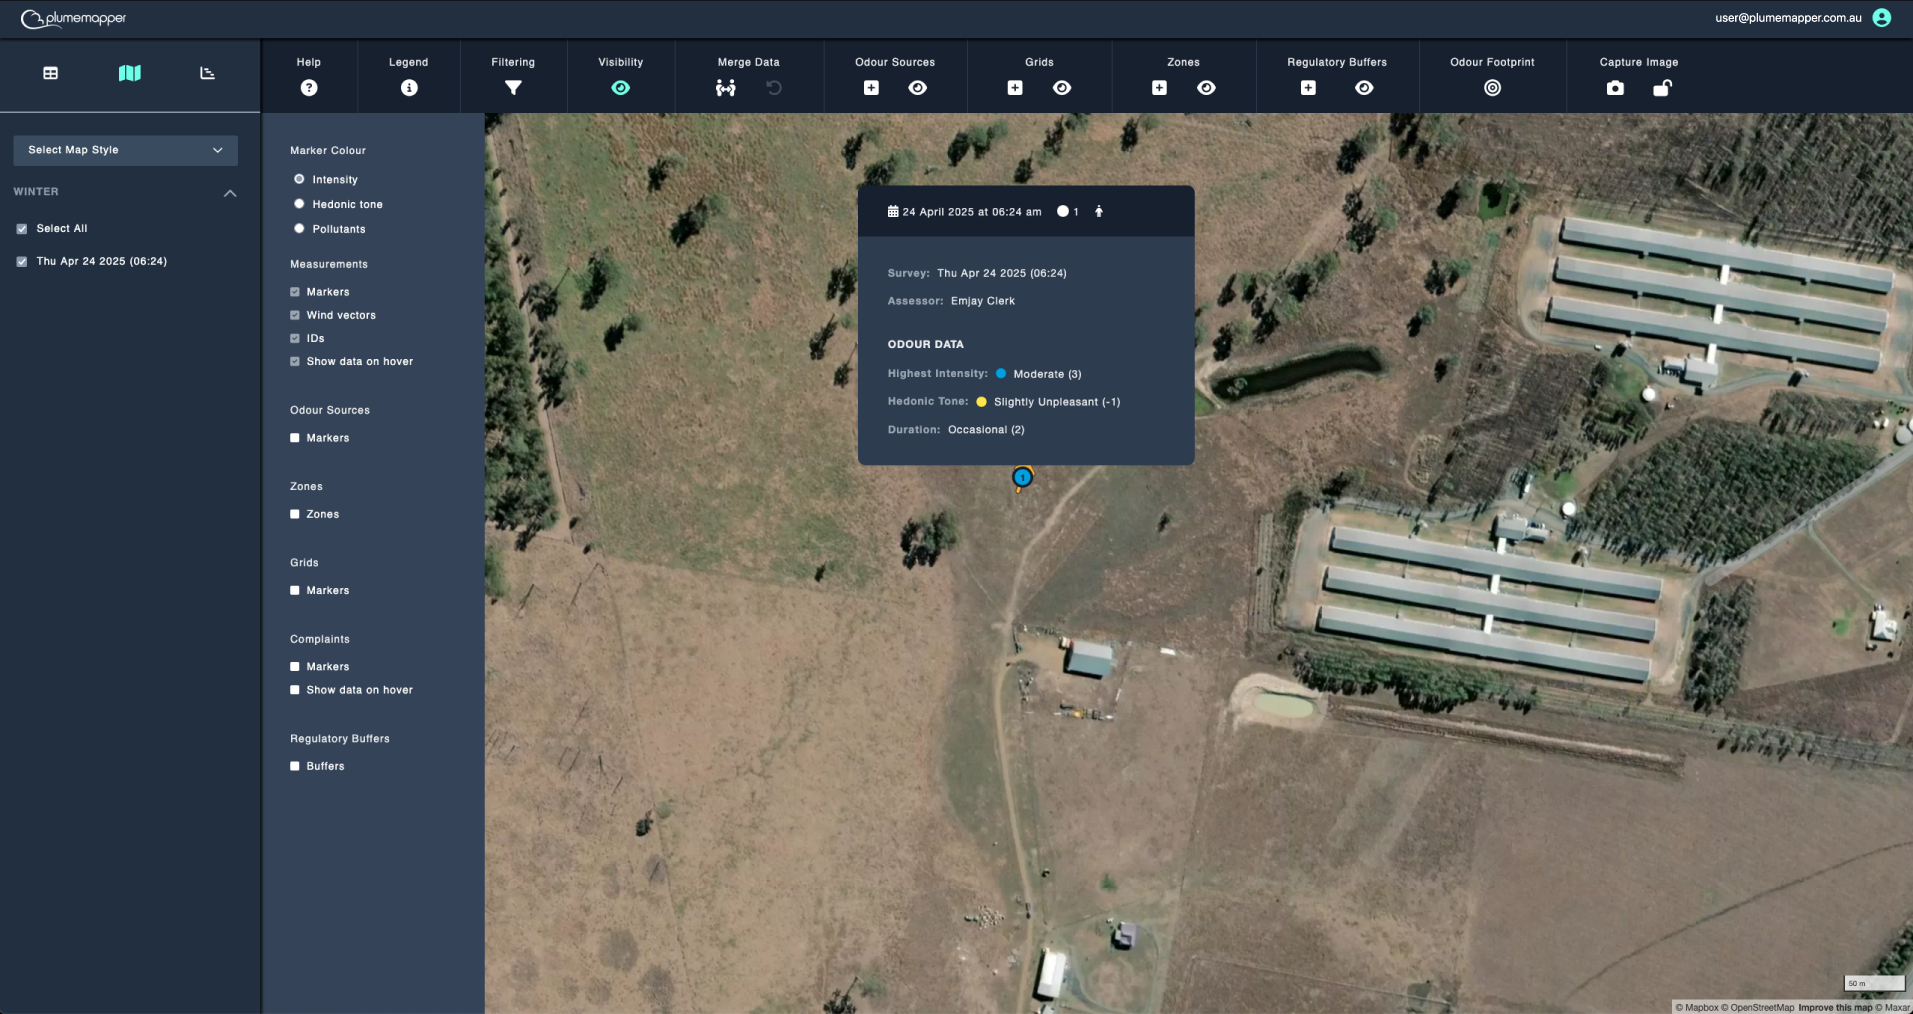
1.b. Measurements.
- Markers: Show or hide measurements on the map.
- Wind vectors: Show or hide the wind arrow, if there is wind data recorded on the measurement.
- IDs: Show or hide the measurement ID.
- Show data on hover: when checked, you can view a snapshot of measurement data, as shown in the image below.
1.c. Odour Sources.
- Show or hide static odour sources.
1.c. Zones.
- Show or hide zones.
- When checked, there will also be an option to show or hide zone names.
1.d. Grids.
- Show or hide grid points.
1.e. Complaints.
- Show or hide complaint markers.
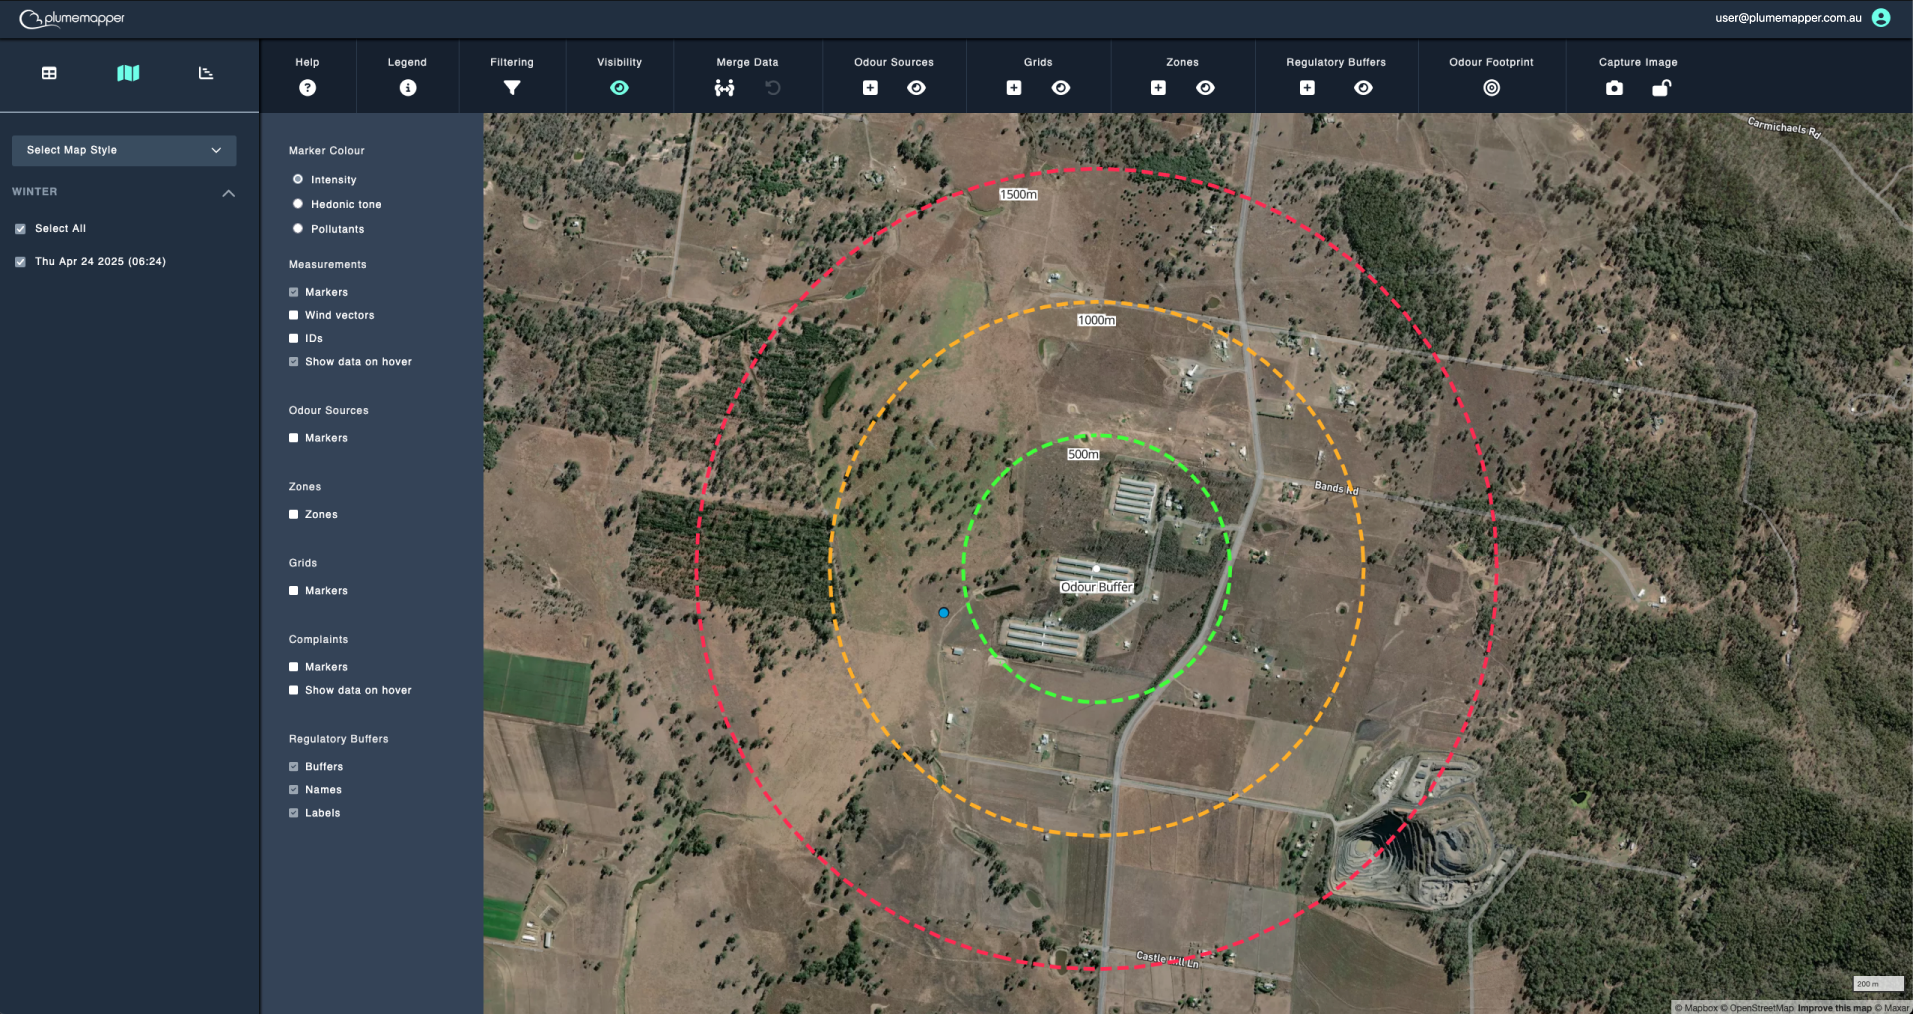
1.f. Buffers.
- Show or hide regulatory buffers.
- When checked, there will also be an option to show or hide the name, as well as the separation distance (label) of each buffer.
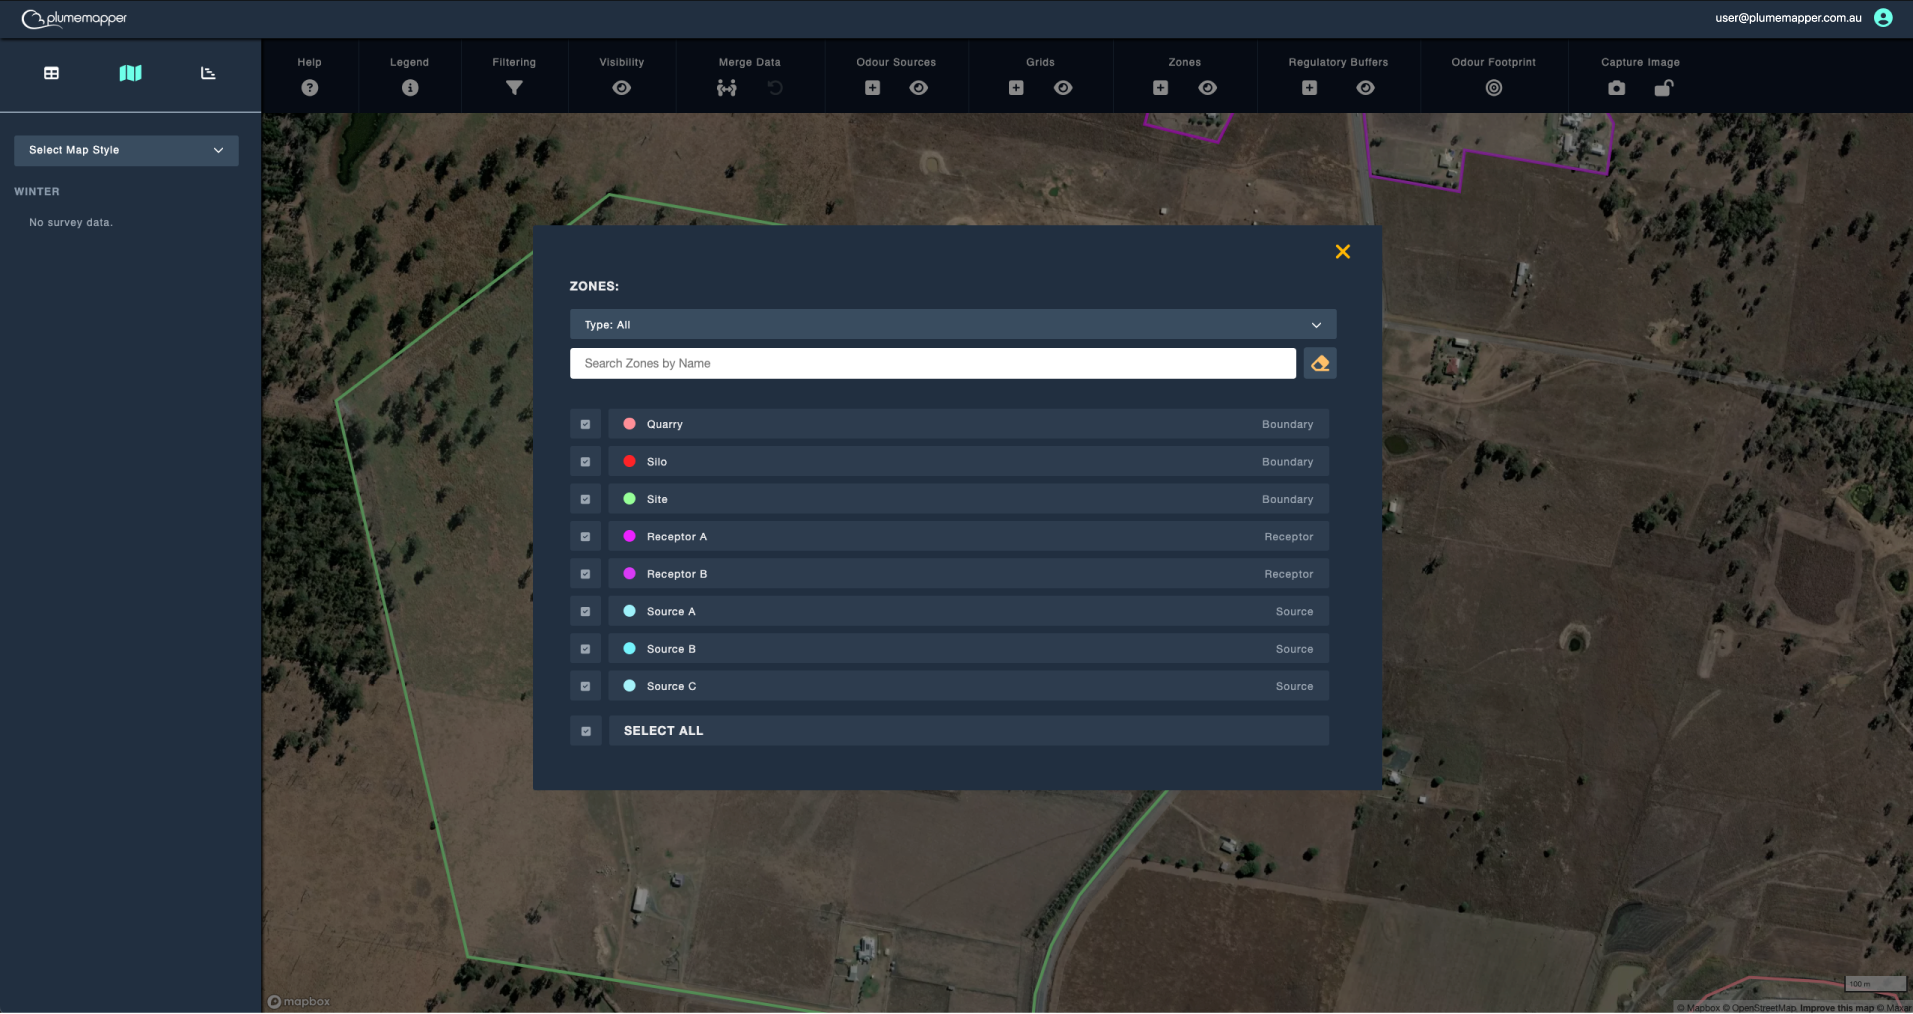
2. Via the feature list, under each respective feature in the toolbar.
Click the icon, under the feature to open the modal.
- For zones you can select the zone type; source, boundary or receptor, as shown below.
- You can search for the feature, by name in the input field.
- Check or uncheck the items on the list you wish to be visible on the map.
Note:
If you have filtered what is visible on the map from this list, when toggling the visibility from the visibility panel, it will only show the filtered items.